Download
1 / 18
180 likes | 301 Views
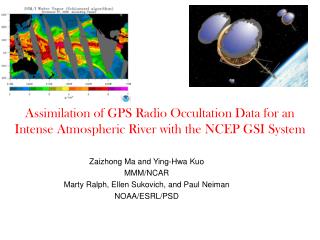
Development and Validation of an Automated, Objective Tool for Atmospheric River Identification and Characterization. Gary Wick, Paul Neiman, and Marty Ralph NOAA ESRL PSD June, 2011 CalWater Meeting. Motivation.

E N D
Development and Validation of an Automated, Objective Tool for Atmospheric River Identification and Characterization Gary Wick, Paul Neiman, and Marty Ralph NOAA ESRL PSD June, 2011 CalWater Meeting
Motivation • Assess the ability of NWP models to accurately reproduce characteristics of AR events • Frequency of occurrence, strength, and position • Function of factors such as resolution and forecast lead • Identification and characterization of AR events in multiple geographic regions over extended periods
The Need • Manual interactive analyses have proven valuable in constructing a climatology of landfalling AR events (Neiman et al., 2008) • Model validation requires analysis of forecasts from different models at multiple different lead times in addition to the observations • An objective, automated procedure applicable to both model and observational fields is required to efficiently analyze all the required data
16-Feb-04; p.m. comp. North coast IWV >2cm: >2000 km long South coast IWV >2cm: <1000 km wide 1000 km SSM/I Integrated water vapor (cm) Atmospheric River Inventory • Inspect 2x-daily (a.m. and p.m.) SSM/I IWV satellite composite images: 3 satellites. • Identify IWV plumes >2 cm: >2000 km long by <1000 km wide. • AR landfall at north- or south-coast during a.m. and p.m. SSM/I composite images on given day.
Objective River Identification Procedure • Isolate top of the tropical water vapor reservoir • Threshold IWV values at multiple levels and compute gradients • Cluster points above thresholds and compute skeleton to estimate axis • Identify points satisfying width criteria • Cluster center points to identify segments of sufficient length • Extract AR characteristics • Determine if AR intersects land or is potentially influenced by data gaps Example from November 7, 2006
Primary Extracted Characteristics • Number of rivers present in scene • Location of center points along core of river • Width of river at all points along axis and average width • Core IWV values along axis • Orientation of river at all points along axis
Extracted Characteristics from Consecutive Scenes • Number or frequency of distinct river events over specified period of time • Frequency of river events making landfall • River lifetime • River propagation speed and characteristics • Source and dissipation regions
Validation AgainstLandfalling Climatology • Compared manually and objectively identified landfalling AR events • All days within October-March for 5 cool seasons from 2003-04 to 2007-08. • Identified days with a landfalling river impacting either the north or south coast region in either the ascending or descending regions
Validation Results • 911 Days analyzed • 42 days with no scores • 256 successful AR days • 15 “false positives” • 5 missed events • 593 correct no-AR days • Summary Scores • Critical Success Index: 92.8% • Probability of Detection: 98.1% • False Alarm Rate: 5.5% Overall very positive. Only 2-3 cases suggested potential required modifications to the procedure.
“False Positive” Identifications Primarily narrow core regions at higher IWV thresholds within broader regions at lower thresholds
Missed Events Very high thresholds and where jumps occurred between regions with different thresholds
Potential for Modification • Can adjust required gradients and threshold values for generation of skeletons • Different sensitivity can be used for different applications • Any selection represents a tradeoff between false alarms and missed events • Extending to model-based estimates of water vapor transport
Application to Model Verification • SSM/I Derived IWV for 16 November 2007 • ECMWF 120-hour forecast valid on 16 November 2007
Conclusions • An automated method for identifying and characterizing AR events has been developed • Technique applies to observational data and model fields at arbitrary resolution • Provided characteristics include frequency of occurrence, position, width, core strength, and propagation • Validation against interactive observations demonstrates the technique works very well • Application to model verification underway
Planned Model Comparisons • Real-time comparisons with operational GFS forecasts • Retrospective comparisons with TIGGE archive • ECMWF, UK Met Office, JMA, and CMC • Focus on frequency of occurrence, predicted strength, position, and orientation • Evaluate at multiple forecast intervals including 1, 3, 5, and 7 days • Metrics to include probability of detection, false alarm rate, and biases in landfalling position and strength
Observations of River Strength Integrated Water Vaporfrom SSM/I Integrated VaporTransport from Reanalysis(kg s-1 m-1)