Download

1 / 40
410 likes | 469 Views
TROPHIC STRUCTURE. READINGS: FREEMAN, 2005 Chapter 54 Pages 1243-1247. ECOSYSTEM. ECOSYSTEM. Consists of a community and its physical environment. The non-living (abiotic) components of an ecosystem include air, water and soil.

E N D
TROPHIC STRUCTURE READINGS: FREEMAN, 2005 Chapter 54 Pages 1243-1247
ECOSYSTEM • Consists of a community and its physical environment. • The non-living (abiotic) components of an ecosystem include air, water and soil. • Ecosystem scientists seek to study the physics and chemistry of how energy flows and nutrients cycle. • Among the practical problems that they address are global warming and pollution.
ECOSYSTEM • Matter and energy are continually moving from the physical environment through living things and back into the physical environment. • Energy flows. • Matter recycles.
ECOSYSTEM The muscle you move when you blink is powered by the energy you borrowed from a plant or animal that in turn got it from the sun. It is now dissipated in the form of low grade heat; no longer to be used by an other living or non-living thing.
ECOSYSTEM Each breath you take is a reminder of the fact that matter cycles. The oxygen you take from the air is combined with the carbon you got from a plant or animal and put back into the air.
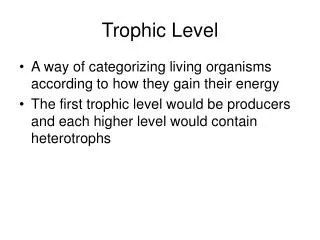
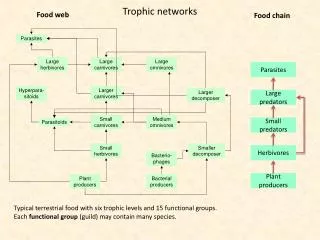
TROPHIC STRUCTURE • Trophic structure is the pattern of movement of energy and matter through an ecosystem. • It is the result of compressing a community food web into a series of trophic levels.
TROPIC STRUCTURE For example, the biomass of all species found in the green and brown food webs from Hubbard Brook could be combined into producer and consumer groups to form a trophic structure diagram.
Some of the Decomposers and Detritivores in the Hubbard Brook Ecosystem
Most Species Occupy More Than One Trophic Level in the Hubbard Brook Ecosystem
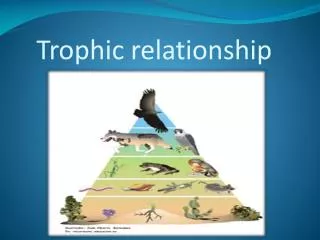
TROPHIC STRUCTURE • The result of combining all producers and consumers in Hubbard Brook would be a biomass pyramid. • Since consumers can be at several trophic levels, the fraction of the food they consume at each trophic level is determined and proportioned among levels. 2O & HIGHER LEVEL CONSUMERS 1O CONSUMERS PRODUCERS
TROPHIC STRUCTURE Detritivores (species that feed on the dead remains of organisms) are also known as decomposers. These include bacteria, fungi and invertebrate animals of numerous species. 2O & HIGHER LEVEL CONSUMERS DECOMPOSERS 1O CONSUMERS PRODUCERS
BIOMASS PYRAMIDS • In a biomass pyramid each tier represents the standing crop biomass (total dry weight of all species) included in a trophic level. • In general, most such pyramids narrow sharply from producers at the base to the top level consumers. • In a few exceptions, primary consumers outweigh producers.
BIOMASS PYRAMID • As mentioned earlier, biomass is the dry weight (-water) of living matter. • It is most often expressed as grams/square meter (g/m2). • This pyramid was among the first constructed.
BIOMASS PYRAMID 2O& HIGHER CONSUMERS (11*) 1O CONSUMERS(132*) CORAL REEF in ENIWETOK ATOLL PRODUCERS (703*) * (g/m2)
BIOMASS PYRAMID 2O& HIGHER CONSUMERS (O.01*) 1OCONSUMERS(0.6*) OLD FIELD in GEORGIA PRODUCERS (470*) * (g/m2)
BIOMASS PYRAMIDS (* g/m2) (4*) 2O … (2.3*) (11*) 1O (22*) UNFERTILIZED FERTILIZED WEBER LAKE, WISCONSIN (96*) P (170*)
BIOMASS PYRAMIDS (32*) 1O (21*) (16*) P (4*) LONG ISLAND SOUND ENGLISH CHANNEL Producers have a lower standing crop due to being much smaller and having a much higher rate of reproduction.
PYRAMIDS OF ENERGY (PRODUCTIVITY) • The transfer of energy from one trophic level to the next is never 100% efficient. • Therefore, all pyramids of energy are “bottom large”. No exceptions. • Ecological efficiencies of transfer from one trophic level range from 5% to 20%. • Thus, 80% to 95% of the energy at one trophic level is never transferred to the next.
PYRAMID OF ENERGY • This is the energy pyramid for Silver Springs, Florida. • Energy units are in kilocalories, or you known them as food calories or large calories (Calories). • This is an annual or average year estimate; per year.
PYRAMID OF ENERGY • This is a hypothetical energy pyramid. • It assumes a 10% efficiency of energy transfer across all trophic levels, except in the conversion of solar energy (only 1% efficient). • Note energy units are in joules (J). 1 J = 0.239 cal.
Why Is Energy Transfer Not 100% Efficient? • When energy is changed from one form to another, some is degraded in the form of heat. This law of thermodynamics is true for all physical-chemical systems, including living ones. • One ecologist summarized this fact by the statement: “There is no such thing as a free lunch.” All physical transactions come at a cost of energy.
Why Is Energy Transfer Not 100% Efficient? • Entropy explains why food chains have limits to their length. • As Freeman (2005) points out low and high productivity ecosystems were equally likely to contain only four trophic levels. • Although it is popular to speak of “energy loss”, this energy is simply degraded as a low grade heat. • Energy flows; it can not be recycled.
MEASURING NET ANNUAL PRIMARY PRODUCTION • Field measurement of annual net primary production entails random plot assignment, clipping and sorting vegetation, drying and weighing plant material. • Data is often reported as grams of biomass per square meter per year or kilocalories per square meter per year or Joules per square meter per year.
NET PRODUCTION, GROSS PRODUCTION & RESPIRATION • Plants accumulate matter (and energy) through photosynthesis (gross production). • Plants use matter (and energy) during respiration (respiration). • Net production = Gross production - Respiration • Production (Gross or Net) is either expressed in units of mass (g /m2 /year) or energy (kcal /m2 /year).
Net Primary Production and Evapotranspiration • Moisture and temperature influence the rate of net primary production. • Measures of the rate at which water evaporates from the land and transpires off plants are highly correlated with net primary production.
Variation in Annual Net Primary Production • The effect of precipitation (water) is seen as one travels from east to west through the NA grassland biome. • The tallgrass prairies of Illinois (top) receive about 36 inches per year. • Short grass prairies of western Kansas get only about 15 inches. • Average annual temperatures are only slightly higher in western Kansas.
NET PRODUCTION IN SOME MAJOR BIOMES Net Production / Unit Area ( grams / meter 2 / year)
Net Productivity in Marine Ecosystems • The most productive ecosystems on the planet are found in coral reefs and marine algal beds. • Some of the least productive ecosystems are found in the open ocean.
Net Productivity in Marine Ecosystems Although open ocean has the lowest net primary productivity, the percentage of earth’s productivity is greater than tropical forests due to it occupies nearly 65% of the planet’s surface.
Measuring Net Productivity in Marine Ecosystems • A global view of marine productivity is provided by sensors that measure various wavelengths of light from satellites. • A more detailed of the biota involved in net production is obtained by direct sampling of the water column.
Iron Fertilizer Increases Marine Primary Productivity (I) • Marine phytoplankton are the major contributors to photosynthesis and thus primary production. • Freeman (2005) describes an experiment designed to increase productivity by these algal species. See Figure 54.5 on page 1247.
The total amount of energy that plants assimilate by photosynthesis is called: a. gross primary production b. net primary production c. biomass
Which of the following ecosystems would you expect to have the highest primary productivity? a. subtropical desert. b. temperate grassland. c. boreal forest. d. tropical wet forest.
One of the lessons from a pyramid of energy is that: a. only one-half of the energy in one trophic level is passed on to the next level. b. eating grain-fed beef is an inefficient means of obtaining the energy trapped by photosynthesis. c. most of the energy from one trophic level is incorporated into the biomass of the next trophic level. d. the energy lost in cellular respiration is 10% of the available energy in each trophic level.