Download
1 / 22
240 likes | 585 Views
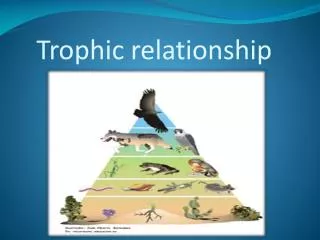
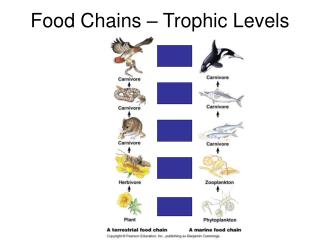
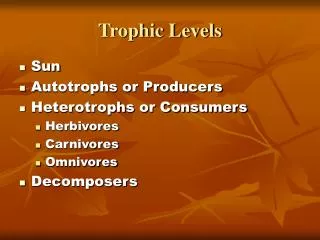
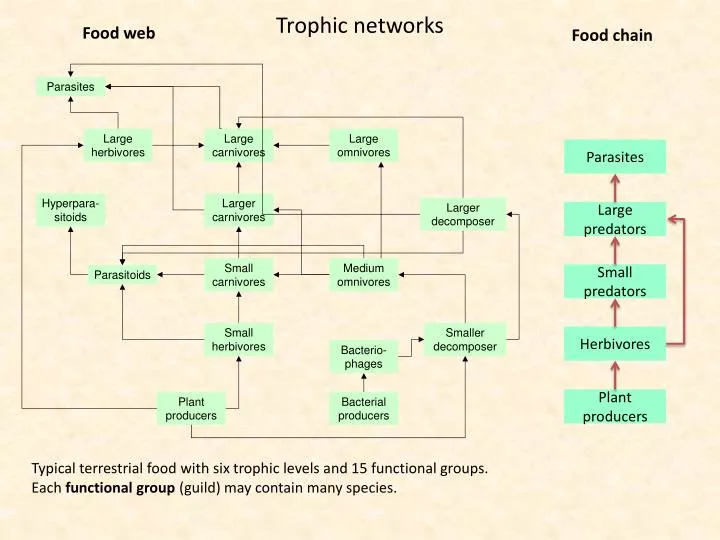
Trophic networks. Food web. Food chain. Parasites. Large predators. Small predators. Herbivores. Plant producers. Typical terrestrial food with six trophic levels and 15 functional groups. Each functional group (guild) may contain many species. .

E N D
Trophic networks Food web Food chain Parasites Large predators Small predators Herbivores Plant producers Typical terrestrial food with six trophic levels and 15 functional groups. Each functional group (guild) may contain many species.
Web size The total number of elements S (species) in the web Connectance The proportion of realized links L in the web Linkage density The proportion of realized connections per species Food chain length The average length of single food chains Proportions of top, intermediate, and basal species. The proportion of omnivores. Omnivores are species that feed on more than one basic source of food (more than one trophic level) Loop, intraspecific feeding Web size: 5 Links: 4 Connectance: 4/(5*4/2) = 0.4 Linkage density: 4/5 = 0.8 Food chain length: 2 Omnivores: 0 Basal species: 1 Intermdeiate species: 2 Top species: 2 Predator Predator Herbivore Herbivore Plant Loops do not count
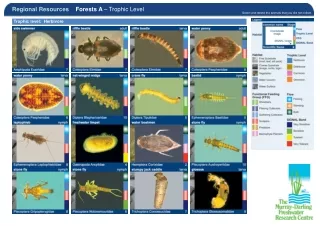
Pitcherplant food (Nepenthes albomarginata) web Photo Nepenthes Loop, Cannibalism
Trophicalcascades Energy Abundance Biomass 0.1 2 2 Largepredators 1 80 15 Small predators 10 100 100 Herbivores 100 120 20 Plants Trophicalcascadesvary from habitat to habitat. Theyare habitat specific In terrestrialhabitatsabout 10% of energyispassed from eachlevel to the nexthigherlevel (rule of Lawton). In marine food webs the biomass and abundancepyramidsaresometimeinverted. The paradox of the plankton
Why is the world green? With predators of herbivores Venezuela Terborgh et al. 2006, J. Ecol. Without predators of herbivores Comparing the defoliation by herbivores on small (without predators), intermediate (some arthopod predators ) and large islands/mainlands (all types of predators) Terborgh et al. (2006) corroborated the hypothesis of Hairston, Smith, and Slobodkin (HSS) that herbivore predators control defoliation and keep the world green. Mortality Recruitment Plant defense did not play a major role
Polis 1998, Nature395: 744-745 An example how complex food webs might be. Each trophic level may contain several up to several hundreds of species. Islands in the Gulf of California.
Terrestrial arthropod dominated food chains are often shorter than marine food chains Schoenly et al. 1991, Am. Nat 137: 597-638 Food chain involing insect parasitoids have often more than five levels. Terrestrial food chains have rarely more than five levels. Mikiola fagi galls Platygaster spec. Torymus auratus
Do terrestrial and marine food webs differ in structure ? Schoenly et al. 1991, Am. Nat 137: 597-638 Terrestrial webs Haven, 1997, Oikos 78: 75-80 Marine webs
Predator numbers increase linearly with the number of asvailable prey species The total richness of predators is often higher than the number of prey species Schoenly et al. 1991, Am. Nat 137: 597-638 Numbers of food chain in a web increase to the power of species richness. The upper boundary marks the limit of stability.
Parasitoid – aphid relationship on oaks Rajmanek and Stary 1979, Nature 280: 311-313
Food web connection and stability The May equation predicts low linkage density at higher connection rate D: Linkage density S: species number C: connectivity Rajmanek and Stary 1979, Nature 280: 311-313 The May equation predicts an upper limit of connectance for a stable food web. Schoenly et al. 1991, Am. Nat 137: 597-638
Food web complexity is limited by species richness SC: measure of food web complexity Schoenly et al. 1991, Am. Nat 137: 597-638 Aquatic food webs • Mechanisms that stabilize food webs: • Weak and variable links • Low connectance • Dietary switches • Omnivory The May eqaution is based on simplified random food webs with density dependent regulation.
The temporalstability of food webs Omnivorystabilizes food webs High proportion of specialistspecies Intermediateproportion of specialistspecies Temporalvariabilityamongspecies High proportion of omnivorousspecies Disturbed Undisturbed Fagan 1997, Am. Nat. 150: 554-567 Mount Saint Helens blowdown zone Mount St. Helen’srecoveryis a naturalexperiment on succession and communityecology.
Food chain length and habitat properties Fresh water food chain length of North American lakes increase with lake size but not with productivity Compilation of well resolved food chains Hall and Raffaelli 1991, J. Anim. Ecol. 60: 823-841. Post et al. 2000, Nature 405: 1047-1049 Average food chain length asymptotically reaches a plateau independent of species richness.
Food web complexity and ecosystem variability in ponds • Linkage density of fresh water insect dominated small pond food webs increased with • Species richness • Habitat duration • and decreases with • Pond environmental variability Connectance was lowest at average species richness, variability, and pond duration. Schneider 1997, Oecologia 110: 567-575
Empirical interaction matrices Pollination networks Plants From Ollerton et al. 2003, Ann. Botany 92: 807-834 Kratochwil et al. 2009, Apidologia 40: 634-650 Bees
The matrix approach to mutualistic and food webs • What are mutualistic webs: • Plant – pollinator webs • Plant seed disperser webs • Plant herbivore webs • Predator prey webs • Host parasite webs • Competition webs Pollinators Generalists Plants Specialists • Generalist pollinator visit most plant species • Specialist pollinator visit the most popular plant species • Mutualistic networks contain forbidden links Specialists Unexpected link Generalists Nestedness is defined as the ordered loss of links in a mutualistic matrix where rows and coloumns are sorted according to species richness. Linkages: number of filled cells in the matrix Linkage density: L/S1 Connectance: Matrix fill, L/(S1S2)
The architecture of mutualistic networks Pollination networks Seed disperser Foods webs Jordi Bascompte1967- Bascompte 2003, PNAS 100: 9383-9387 Weak Anthropic Principle (Carter 1973): We must be prepared to take account of the fact that our location in the universe is necessarily privileged to the extent of being compatible with our existence as observers. In ecology this means: Ecological systems do not have a random strucure. They have that non-random structure that enabled them to survive during evolution. Bastolla et al. 2009, Nature 458: 1018-1021 • Mutualistc networks are often nested. • The nested architecture promotes diversity and stability
Nestednessas an emergent property of ecological systems Mutualistic webs (comparirson of two trophic levels) are most often nested. Food webs are often compartmented Foods webs have a modular structure. Modularity tends to stabilize food webs. Modules itself have a nested structure. Nestedness tends to stabilize mutualistic networks.
Stability, resilience and tipping points • Ecologial systems (particularly networks) can be in various states: • Instable equilibria are at tipping points and can move towards different directions. • Local stable equilibria can easily be forced to achieve other stable states. • Global equilibria need much energy to leave their state. • Inequilibria can easily move between different states. Instable equilibrium Local stable state Global stable state Tipping point Low stability • Resilience refers to the speed of a systen to return to a stable state. • Resistence is the ability of a system to avoid displacement. • Robustness is the ability of a system to exist witin a wide range of conditions. • Stabilityrefers to the amplitude of variability • Sustainability i the capacity to endure Local stability Global instanility Low resistence
Multiple states Instable equilibrium A state reaches its tipping point Local stable state Global stable state Food webs and tipping points Probability • Indicators of critical tipping points: • Resilience slows down • Dominant eigenvectors of the food web matrices shorten • Increased variance • Variance / mean relationships increased • Multimodality of states • Increasing connectivity and decreasing diversity State Tipping points define states where a system irreversably changes the probability distribution of states.
Robustness The importance of wildbees for pollinationstability Meta-analysis of empirical food ebs Dunne 2002, Ecol. Lett 5: 558 Garibaldi et al. 2013. Science 339: 1608 In empirical foods webs robustness increases with connectance. In random foods webs robustness decreases with connectance. Therefore, empirical food webs have a special non-random structure that promotes stability. Wild insectsincreasefruitproductionmoreeffectivelythanhoneybeesalone. Speciesrichnessincreasesecologicalfunctioning