Download

1 / 31
310 likes | 321 Views
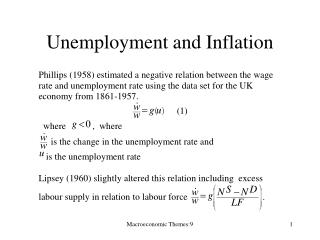
6. Jobs and Unemployment. CHAPTER. EYE ONS. Aggregate hours Full employment Labor force Discouraged worker Working age population Full-time worker Unemployment rate Involuntary part-time worker Cyclical unemployment Part-time worker Frictional unemployment Potential GDP

E N D
6 Jobs and Unemployment CHAPTER EYE ONS Aggregate hours Full employment Labor force Discouraged worker Working age population Full-time worker Unemployment rate Involuntary part-time worker Cyclical unemployment Part-time worker Frictional unemployment Potential GDP Seasonal unemployment Structural unemployment Natural unemployement rate Labor force participation rate
The Current Population Survey • Conducted by: • 1,600 field interviewers and supervisors of the • The Bureau of Labor Statistics and • Bureau of the Census • Each month every field interviewer • Contacts 37 households • Asks basic demographic questions about all persons living at the address • Detailed labor force questions about persons aged 15 or over.
The Current Population Survey • Once a household is selected: • They are questioned for 4 consecutive months • And again for the same 4 months a year later. • Each month: • Addresses that have been surveyed 8 times are removed • 6,250 new addresses are added. • These rotations and overlap of households: • Provide very reliable information • About both monthly and yearly changes in the labor market.
POPULATION SURVEY • Group 1 • Working Age Population • Age 16+, not institutionalized (jail, hospital, mental, military) • Everyone else • Group 2 • In the Labor Force • Employed + Unemployed = Labor Force • Not in the Labor Force • Retired, in school, couch potatos • Group 3 • Employed • Unemployed
POPULATION SURVEY • Employed • Paid – Worked at least 1 hour • Unpaid – Worked at least 15 hours • OR • Did not work BUT had jobs from which they were TEMPORARILY LAID OFF • Unemployed • Had no employment • Were available for work • AND • Had applied for a job within the last FOUR WEEKS • OR • Were waiting to be recalled to a job from which they were LAID OFF
June 2009 Data POPULATION SURVEY
Labor force Labor force participation rate = x 100 Number of people unemployed Working-age population Unemploymentrate = x 100 Labor force LABOR MARKET INDICATORS • Unemployment Rate – 4.6% in August 2007 9.5% in June 2009 • Labor Force Participation Rate – 65.8% in August 2007 65.7% in June 2009
LABOR MARKET INDICATORS • Worker Classifications • Discouraged Workers • Has not made an effort to find a job in last 4 weeks • Not included in unemployment or labor force rates • Full-time Workers • Work 35+ hours a week • Part-time Workers • Involuntary (part-time for economic reasons) • Desire a full-time job • Voluntary • Choose to work part-time • Aggregate Hours • Total number of hours worked by all people in a year
LABOR MARKET INDICATORS • Part-time Workers • Part-time jobs remain STEADY across the business cycle • Involuntary Part-time workers FOLLOW the business cycle
LABOR MARKET INDICATORS • Aggregate Hours • Between 1967 and 2007 • 96% - Increase in number of people working (almost double) • 75% - Increase in aggregate hours • Due to shorter work weeks – People work less hours each week on average Fluctuations Follow Business Cycle
Labor Market in the Great Depression • 1929-1939: The Great Depression • 1933: The worst year • real GDP fell 30% • 1in 4 people could not find work.
LABOR MARKET TRENDS • Unemployment • 5.9% - Average Unemployment between 1967 and 2007 • 3.9% in 60’s: Vietnam War and spending due to social programs • Low in Late 90’s: Technology sector • High in 70’s & 80’s: World oil price (1982 recession – almost 10%) • Increases in recessions and Decreases in expansions
MEN • Retired early • Remained in full-time education LABOR MARKET TRENDS • Participation Rate • WOMEN • College education • Technological change in the home • Technological change in the workplace
Unemployment Around the World All of the countries with higher unemployment rates than the U.S. rate also have higher unemployment benefits and more regulated labor markets. US is in the middle The newly industrializing countries of Asia have lower unemployment rates. Differences in unemployment rate were much greater during the 1980s and 1990s than in the 2000s.
Women in the Labor Force • Women labor force participation rates in most advanced countries has increased since the 1960s • Level of participation varies a great deal among nations • Cultural factors play a role • But, economic factors such as education dominate culture
UNEMPLOYMENT: SOURCES and TYPES • Sources of Unemployment • Job Losers – Laid off • Job Leavers – Voluntarily quit • Entrants and Reentrants – Graduate or Reenter Labor Force • Sources of ‘Ending Unemployment’ • Hires – Were unemployed but FOUND A JOB • Recalls – Were temporarily laid off but WERE CALLED BACK • Withdrawals – Stop looking for a job
UNEMPLOYMENT: SOURCES and TYPES Influenced by unemployment compensation • Types of Unemployment • Frictional - Normal Labor Turnover • People entering and leaving • Job creation and destruction • Structural – Changes in Technology or International Competition • New technology eliminates jobs • Jobs are relocated or outsourced to other areas • Seasonal – Seasonal weather patterns • Construction, Farming, Fruit gatherers • Cyclical – Fluctuates with business cycle • Auto worker laid off during recession • Harder, especially on older people • Last longer – skills • Increases in Winter • Decreases in Spring • Increases in recessions • Decreases in expansions
UNEMPLOYMENT: SOURCES and TYPES Notice Teenager Rates • Duration and Demographics Notice Female Rates
UNEMPLOYMENT: SOURCES and TYPES • Full Employment = Natural Unemployment • Achieved when there is NO CYCLICAL UNEMPLOYMENT • Potential GDP • Level of GDP that would be produced IF the economy were at Full Employment • Unemployment Rate • Fluctuates Around the • Natural Unemployment Rate
UNEMPLOYMENT: SOURCES and TYPES • Unemployment Rate fluctuates around the Natural Unemployment Rate • Real GDP fluctuates around Potential GDP When unemployment rate is BELOW the natural rate Real GDP is above Potential GDP Output Gap = RGDP - PGDP
Your Labor Market Status and Activity • Do you plan to one day find a job? • You will most likely have SEVERAL jobs/careers. • You LOOK for job, GET a job, QUIT a job, GET a NEW job, you will pass through many of the population categories used in the Current Population Survey.
Your Labor Market Status and Activity • Think about your current labor market status while you are studying economics: • • Are you in the labor force or not? • • If you are in the labor force, are you employed or unemployed? • • If you are employed, are you a part-time or a full-time worker?
Your Labor Market Status and Activity • Now think about someone you know who is unemployed or who has been unemployed. • Classify the unemployment experienced by this person as • • Frictional • • Structural • • Seasonal • • Cyclical • How can you tell the type of unemployment experienced by this person?
Your Labor Market Status and Activity • The labor market conditions that you face today or when you graduate and look for a job depend partly on general national economic conditions—on whether the economy is in recession or booming. • But the labor market conditions also depend on where you live. • How quickly you find a job depends on: • Willingness to move • Ability to prepare a resume (get an interview) • Ability to interview (select a compatible job)
difference between two variables Current # - original/base # Labor force Labor force participation rate = % Change = % Change = x 100 x 100 x 100 Number of people unemployed Working-age population Original variable original/base # Unemploymentrate = x 100 Labor force FORMULAS-Chapter 6