Download

1 / 23
290 likes | 363 Views
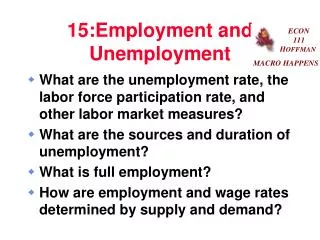
Employment and Unemployment. Not in Labor Force Armed forces Household workers Students Retirees Disabled persons Institutionalized Discouraged workers. Civilian labor force. Total Population age 16 and over. Employed Employees Self-employed.

E N D
Not in Labor ForceArmed forcesHousehold workersStudentsRetireesDisabled personsInstitutionalizedDiscouraged workers Civilian labor force Total Population age 16 and over EmployedEmployeesSelf-employed UnemployedNew entrantsRe-entrantsLost last jobQuit last jobLaid off
Under 16 and/or institutionalized Not in labor force Employed Unemployed UNEMPLOYMENT Measurement of Unemployment, Jan 2005 Labor force participation rate 65.8% 70,575,000 76,858,000 Total Population Jan 2005 estimate 295,412,000 140,241,000 Civilian Labor force 147,979,000 Unemployment Rate 5.2% 7,737,000
7,737,000 147,979,000 X100 = 5.2% Unemployment Rate = UnemployedLabor Force X 100 If the total population is 280 million, and the civilian labor force includes 129,558,000with jobs & 6,739,000unemployed but looking for jobs, then the unemployment rate would be ___%. 4.9 6,739,000 / 136,297,000 x 100 = 4.9%
Persons Not in the Labor Force • 1.8 million persons who were marginally attached to the labor force in January, about unchanged from a year earlier. • These individuals wanted and were available to work and had looked for a job sometime in the prior 12 months. • They were not counted as unemployed—they did not actively search for work in the 4 weeks preceding the survey. • Discouraged workers, a subset of the marginally attached, were not currently looking for work specifically because they believed no jobs were available for them. • The number of discouraged workers, at 515,000 in January, was slightly higher than a year earlier. • The other 1.3 million marginally attached had not searched for work for reasons such as school or family responsibilities.
Three Types of Unemployment Frictional– “temporary”, “transitional”, “short-term.” (“between jobs” or “search” unemployment) • Examples: • People who get “fired” or “quit” to look for a better one. • 2. “Graduates” from high school or college who are looking for a job. • 3. “Seasonal” or weather-dependent jobs such as: • “agricultural”, “construction”, “retail”, or “tourism.” [lifeguards, resort workers, & migrant workers.] Frictional unemployment signals that “new jobs” are available and reflects “freedom of choice”. These are qualified workers “transferable” skills.
Three Types of Unemployment Structural – “technological”or “long term”. basic changes in the “structure”of the labor force which make certain “skills obsolete”. • √ Automation may result in job losses. Consumer taste may make a good “obsolete”. • • The auto reduced the need for carriage makers. • • Farm machinery reduced the need for farm laborers. • √ “Creative destruction” means as jobs are created, other jobs are lost. Jobs of the future destroy jobs of today. “These jobs do not come back.” “Non-transferable skills” – choice is prolonged unemployment or retraining. Frictional and Structural make up the “natural rate of unemployment”.
Three Types of Unemployment Cyclical –“economic downturns” in the business cycle. √ Cyclical fluctuations” caused by deficient demand for goods and services √ “Durable goods” jobs are impacted the most. • Purchase of these durables can be postponed because they can be repaired. “Cyclical unemployment” is “real unemployment”. “These jobs do come back.”
Survey on Unemployment • BLS calls 60,000 households every month. • They ask three questions: • Are you working? If the answer is no, • 2. Did you work at all this month-even 1 day? • You are a member of the LF if “yes” on 1 or 2. • 3. Did you look for work during the lastmonth? • [agency, resume, interview] • A “yes” counts you as • part of the LF. • A “no” means you are not counted. You are a “discouraged worker.” The labor force consists of the employed and unemployed.
Full Employment Full employment is less than 100% because the economy is dynamic—frictional and structural unemployment are often inevitable. • The Full employment rate of unemployment or the Natural Rate of Unemployment (NRU) is present when the economy is producing its potential output. • NRU is present when the number of job seekers equals the number of job vacancies. • When labor markets are in balance, there is lag time. Workers seeking jobs and those retraining are the cause of the lag. The Natural Rate of Unemployment exists when the cyclical unemployment is zero.
The NRU is not static; the economy will want to move to its potential output and cyclical unemployment can interfere. When labor markets are tight, firms quickly retrain structurally unemployed and workers who previously were not in the labor force come back, the economy can operate below the NRU. • Economists in the 1980’s thought the NRU was 6%. Today, the figure is 4 to 5%. Why? • √ Fewer workers available as baby boomers age. • √ Workers find jobs more quickly—the internet is a source of information. • √ Changes in the welfare system put more people in the labor force. • √ Doubling of US prison population removes relatively high unemployment individuals from the labor force.
Europe’s Natural Unemployment Rate is 8%-11% 1. Labor unions are stronger 2. There are more restrictions on firing workers which makes employers reluctant to hire them in the 1st place. 3. Much more generous unemployment insurance 4. Sweden-(free college); unemployment for 2 years with 95% pay; and maternity leave is for two years.
5 Jobs for Independence 1. Computer engineer 2. System analyst 3. Psychologist 4. Clinical social worker 5. Marketing, advertising, public relations manager 5 Jobs for the Money 1.Physician/surgeon ($156,000/$200,000) 2. Airline pilot ($95,794) 3. Computer engineer ($70,000) 4.Management consultant ($60,000) 5. Lawyer($58,000) 6. Teaching - oh!! Hottest Jobs “Econ, Econ”
JOB FACTOID! In 1960, 60% of jobs could be held by unskilled or semi-skilled workers. Today, it is only 15%.
Hottest Jobs These jobs will have the most net gains through 2012 (in 1000’s) Teachers K-12 724,000 Registered Nurses 623,000 Post secondary teachers 603,000 Customer service reps 458,000 Computer support 420,000 General Operations Manager 376,000 Sales reps 356,000 Truck drivers 337,000 Software engineers 307,000 Accountants and auditors 205,000 Bureau of Labor Statistics
Computer Engineering $52,169 • Chemical Engineering $52,038 • Electrical/Electronics Engineer $50,566 • Computer Science $50,543 • 5. Mechanical Engineering $49,400 • 6. Mgmt Info Sys/Bus. Data Processing $42,543 • 7. Economics/Finance $42,150 • 8. Civil Engineering $41,067 • 9. Accounting $42,360 • 10. Management Info Sys $40,000 • 11. Teaching $40,600 • 12. Nursing $37,803 • 13. Marketing/Marketing Mgmt. $36,674 • 14. Business Admin/Mgmt $36,515 • 15. Communications $28,000 • 16. Psychology $27,000 Top Paying College Majors for 2004
Fastest Growing Fields These jobs will add the largest percentage of positions through 2012 Network Systems and Communication Analysts 57% Physician Assistants 48.9% Software Engineers 45.5% Physical Therapist Assistants 44.6% Fitness Trainers 44.5% Database Administrators 44.2% Dental Hygienists 43.1% Hazardous material removal workers 43.1% Computer Systems analysts 39.4% Environmental Engineers 38.2%
The FEDS Pay Well Many US Government jobs pay a higher average salary than what the private sector pays.
GLOBAL PERSPECTIVE Unemployment Rates 5 Industrial Nations 1992 - 2002 15 10 5 0 France Germany U.K. U.S. Japan 1992 1997 2002 Source: Economic Report of the President, 2003