Download
1 / 23
230 likes | 238 Views
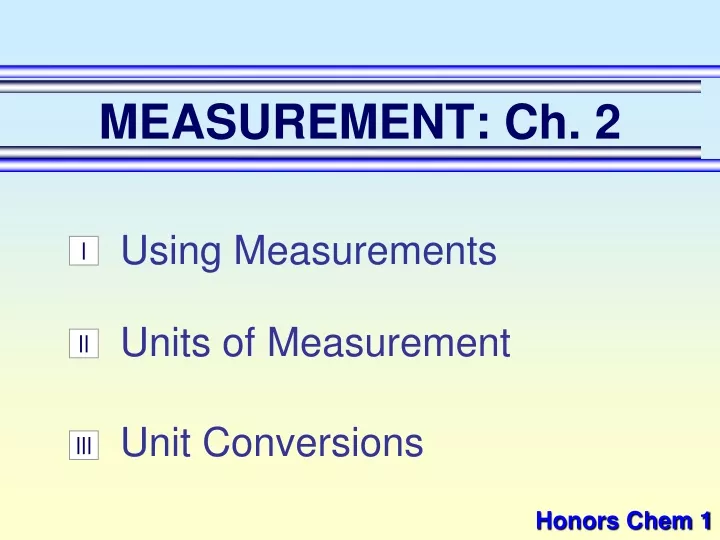
MEASUREMENT: Ch. 2. Using Measurements. I. Units of Measurement. II. Unit Conversions. III. Honors Chem 1. MEASUREMENT: Ch. 2. Using Measurements (p.44 - 57). A. Accuracy vs. Precision. accuracy - how close a measurement is to the accepted value

E N D
MEASUREMENT: Ch. 2 Using Measurements I Units of Measurement II Unit Conversions III Honors Chem 1
MEASUREMENT: Ch. 2 Using Measurements (p.44 - 57)
A. Accuracy vs. Precision • accuracy - how close a measurement is to the accepted value • precision - how close a series of measurements are to each other ACCURATE = CORRECT PRECISE = CONSISTENT
H/L Accuracy? H/L Precision? Low accuracy Low precision
H/L Accuracy? H/L Precision? Low accuracy High precision
H/L Accuracy? H/L Precision? High accuracy High precision
your value you get from lab ‘known’ value B. Percent Error • indicates accuracy of a measurement - actual accepted = ´ % error 100 accepted
% error = 2.9 % Example • A student determines the density of a substance to be 1.40 g/mL. Find the % error if the accepted value of the density is 1.36 g/mL.
C. Significant Figures • aka sig figs or S.F. • indicate precision of a measurement. • recording sig figs • sig figs in a measurement include the known digits plus a final estimated digit 2.36 cm
C. Significant Figures • Counting Sig Figs Three rules: < 1 [less than one]– start at first non-zero and count all numbers to the RIGHT > 1 [greater than one] with NO decimal – count from non-zero to non-zero > 1 [greater than one] WITH decimal – count all numbers
Example Counting sig figs: 1. 23.50 1.23.50 4 sig figs 3 sig figs 2. 402 2.402 3. 5,280 3.5,280 3 sig figs 2 sig figs 4. 0.080 4. 0.080
3 SF C. Significant Figures • Calculating with Sig Figs • multiply/divide - the # with the fewest sig figs determines the # of sig figs in the answer (13.91g/cm3)(23.3cm3) = 324.103g 4 SF 3 SF 324g
C. Significant Figures • Calculating with Sig Figs (cont.) • add/subtract - the # with the least # of decimal places determines the # of decimal places in the answer 224 g + 130.2 g 354.2 g 224 g + 130.2 g 354.2 g 3.75 mL + 4.1 mL 7.85 mL 3.75 mL + 4.1 mL 7.85 mL 354 g 7.9 mL
D. Scientific Notation • converting into scientific notation: • move decimal until there’s 1 digit to its left, places moved = exponent • large # (>1) positive exponentsmall # (<1) negative exponent • only include sig figs! 65,000 kg 6.5 × 10⁴ kg
2,400,000 g 6.72 102 L Example Convert TO sci. notation: 2.4 106 g Convert FROM sci. notation: 672 L
a. accurate b. precise (but not accurate) c. both accurate and precise d. neither accurate nor precise 1. These values were obtained as the mass of products from the same reaction: 6.62 g; 6.67 g; 6.63 g. The known mass of products from that reaction is 7.60 g. The values are
a. good precision b. good accuracy c. poor precision d. poor accuracy 2. Using the same balance, a chemist obtained the values 4.225 g, 5.326 g, and 4.85 g for the mass of a sample. These measurements have
Student A Student B Student C Student D 3. Four students each measured the mass of one 1.43 g sample four times. The results in the table above indicate that the data collected by ____ reflect the greatest accuracy and precision. Mass Data of Sample Trial 1 Trial 2 Trial 3 Trial 4 Student A 1.43 g 1.52 g 1.47 g 1.42 g Student B 1.43 g 1.40 g 1.46 g 1.44 g Student C 1.54 g 1.56 g 1.58 g 1.50 g Student D 0.86 g 1.24 g 1.52 g 1.42 g
a. (13.30 g) ÷ (2.4 mL) 5.5 g/mL 2 SF 4. Calculating with sig figs: 4 SF 2 SF = 5.54166 g/mL b. 14.9 g - 0.14 g 14.8 g 14.76 g
2.17 10-3 8.472 102 9.13 10-1 3.20615 102 7.48 10-6 9.042 1011 5. Write in exponential/scientific notation: • 0.00217 • 847.2 • 0.913 • 320.615 • 0.00000748 • 904,200,000,000
356,000 2,700 0.0000824 0.000000000145 30,320,000 0.000341 6. Write out in full: • 3.56 x 10⁵ • 2.7 x 10³ • 8.24 x 10⁻⁵ • 1.45 x 10⁻¹⁰ • 6.032 x 10⁷ • 3.41 x 10⁻⁴
4 5 5 5 3 5 2 4 7. How many significant figures are in the following numbers? • 4015 • 0.16985 • 405,060 • 0.00032505 • 1.35 • 56.681 • 0.000020 • 79.54
201.0 cm 19.3 g 21 kg 0.03 mL 2.3 403.37 mm 10. Solve the following, giving your answer with the correct number of significant figures and the correct UNITS: • 125.3cm + 75.7cm • 6.2 g + 13.11g • 43.1 kg – 22 kg • 0.0225 mL / 0.75 mL • 153.33 x 0.015 • 151.81 mm x 2.65734 mm