Download
1 / 37

E N D
Companies that don't take steps to realign their offerings with market demand risk failure. Those who address the issue -- usually by breathing new life into their business model -- typically see an increase in revenue by attracting new customers and offering new value to current customers. Statistics show that business model innovators see operational margin growth of more than 5X that of competitors who only practice product or service innovation.
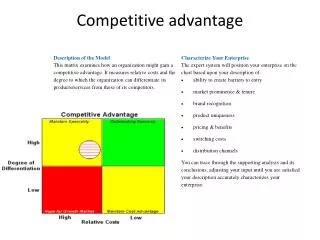
Potential Generic Strategies • Description of the ModelThis chart graphically displays the potential for your enterprise to implement each of the generic strategies. • Characterize Your EnterpriseThe expert system will position your enterprise based upon your description of: • market segmentation • product differentiation • distribution channels • enterprise reputation • relative pricing • cost controls • economies of scale • You can trace through the supporting analysis and its conclusions, adjusting your input until you are satisfied your description accurately characterizes your enterprise.
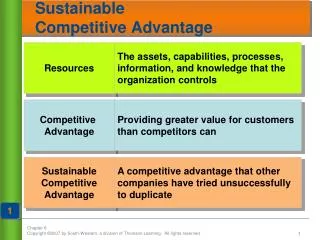
Potential Generic Strategies A COST LEADERSHIP STRATEGY is based on the enterprise's ability to control their operating costs so well that they are able to price their products or services very competitively and still generate high profit margins, thus having a significant competitive edge. A DIFFERENTIATION STRATEGY involves the offering of a product or service that is clearly unique when compared to alternatives. Uniqueness can take many forms such as brand image, technology, functionality, customer service, dealer networks and many others. It is likely that differentiation will involve a combination of two or more of these forms. A FOCUS STRATEGY may be the most sophisticated of the generic strategies, in that it is a more intense form of either the cost leadership or differentiation strategy. It is designed to address a focused segment of the marketplace, product form or cost management process and is usually employed when it isn't appropriate to attempt an across the board application of cost leadership or differentiation. It is based on the concept of serving a particular target in such an exceptional manner, that others cannot compete. Usually this means addressing a substantially smaller market segment than others in the industry, but because of minimal competition profit margins can be very high.
Marketing Strategy Matrix Description of the ModelThe General Electric Company, with the aid of the Boston Consulting Group and McKinsey and Company, pioneered the nine cell strategic business screen illustrated here. The circle on the matrix represents your enterprise. Both axes are divided into three segments, yielding nine cells. The nine cells are grouped into three zones:The Green Zone consists of the three cells in the upper left corner. If your enterprise falls in this zone you are in a favorable position with relatively attractive growth opportunities. This indicates a "green light" to invest in this product/service.The Yellow Zone consists of the three diagonal cells from the lower left to the upper right. A position in the yellow zone is viewed as having medium attractiveness. Management must therefore exercise caution when making additional investments in this product/service. The suggested strategy is to seek to maintain share rather than growing or reducing share.The Red Zone consists of the three cells in the lower right corner. A position in the red zone is not attractive. The suggested strategy is that management should begin to make plans to exit the industry. • Characterize Your EnterpriseThe vertical axis represents the industry attractiveness. The expert system will position your enterprise on the chart based upon your description of: • bargaining power of the buyers • bargaining power of the suppliers • internal rivalry • the threat of new entrants • the threat of substitutes • The horizontal axis represents the firm's competitive strength or ability to compete in the industry. It includes an analysis of: • the value and quality of the offering • market share • staying power • experience • You can trace through the supporting analysis and its conclusions, adjusting your input until you are satisfied your description accurately characterizes your enterprise