Download
1 / 54
540 likes | 697 Views
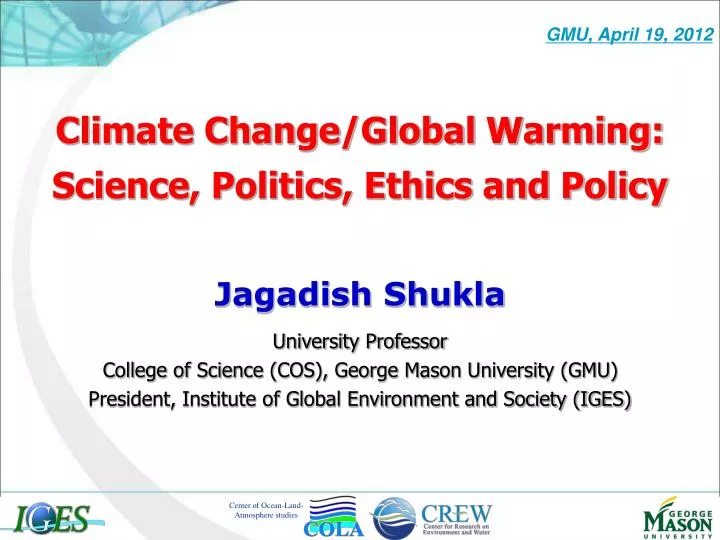
Center of Ocean-Land-Atmosphere studies. GMU, April 19, 2012. Climate Change/Global Warming: Science, Politics, Ethics and Policy. Jagadish Shukla University Professor College of Science (COS), George Mason University (GMU) President, Institute of Global Environment and Society (IGES).

E N D
Center of Ocean-Land-Atmosphere studies GMU, April 19, 2012 Climate Change/Global Warming: Science, Politics, Ethics and Policy Jagadish Shukla University Professor College of Science (COS), George Mason University (GMU) President, Institute of Global Environment and Society (IGES)
Global Warming Global Warming is the increase in the average temperature of the Earth’s near surface air and oceans since the mid-20th century and its projected continuation. (Wikipedia) Global Land-Ocean Temperature (1880-2011) Annual Mean 5-year Mean Relative to the 1951-1980 mean (GISS, New York)
Center of Ocean-Land-Atmosphere studies An Elegant Science Question: Are increases in greenhouse gases responsible for increase in global mean temperature (global warming)? 14.6 Global Temperature & Carbon Dioxide 1860-2008 395 0.76°C (1.4°F) since 1900 14.4 365 0.55°C (1.0°F) since 1979 14.2 335 14.0 13.8 305 13.6 275 13.4
Center of Ocean-Land-Atmosphere studies Science and Politics Percentage of Democrats/Republicans who said that news of global warming was exaggerated (Gallup) Thanks: Ed Maibach, Center for Climate Change Communication (GMU)
Center of Ocean-Land-Atmosphere studies Let us look at the Observations.
Center of Ocean-Land-Atmosphere studies Monthly Mean Carbon Dioxide NOAA CMDL Carbon Cycle Greenhouse Gases Atmospheric carbon dioxide mixing ratios determined from the continuous monitoring programs at the 4 NOAA CMDL baseline observations. Principal investigator: Dr. Pieter Tans. NOAA CMDL Carbon Cycle Greenhouse Gases. Boulder, Colorado. (303) 497-6678
Center of Ocean-Land-Atmosphere studies Sea Level Rise over the Last Century • thermal expansion • added freshwater (melting)
Arctic Sea Ice is Disappearing Sea Ice Cover in mid-Sept. 1979 & 2007
Arctic Sea Ice Minimum (at least 15% sea ice coverage)
Center of Ocean-Land-Atmosphere studies Greenland Ice Mass • The blue error bars include only the contributions from uncertainties in the GRACE gravity fields. Velicogna and Wahr (2006)
Climate Change Facts • CO2 concentration in the atmosphere has increased by 24% between 1959 and 2011 (316 392 ppm) • World CO2 emissions grew by 267% between 1959 and 2011 (9.0 33 Gt CO2 or 2.4 9.0 Gt C) • (Primary reasons: fossil fuel use and land-use change) • The post-industrial rate of increase of CO2, CH4, and N2O was the largest in 10,000 years. • Global mean surface temperature increased 0.8oC 1901-2010, of which 0.5oC of the increase occurred since 1979. • 14 of the past 16 years were the warmest on record. • March 2012 (waning La Niña) was coolest since 1999, yet 16th warmest of 133 since 1880 • In the past 500 years, the warmest 50-year period was 1951-2000.
Climate Change Facts • Sea level has risen 1.7 mm/yr since 1901; 3.1 mm/yr since 1993. • Arctic sea ice extent has fallen by 2.7% per decade since 1978. • (The summer minimum on record occurred in 2007) • Extreme hot nights have increased; frost days have decreased. • Earlier timing of spring events(blooms) on land. • Poleward and upward shifts in plant and animal ranges. • Changes in algal, plankton, and fish abundances (~temperature). • Increase in the acidity of oceans.
What Do We Know Better since 2007?(post IPCC AR4) • Better measurements of • Atmospheric composition • Radiative balance of Earth • Temperature, precipitation, etc. • Chemical content of oceans • Water and ice on the sea and land surface • Improved understanding of natural vs. forced climate variability • Improved models of the physical climate system that more realistically represent observed features • Nascent Earth system models that include important feedbacks from carbon, nitrogen and other cycles
Surface Temperature Trend 1930-2004CMIP5 “historical” Simulations K/decade; global mean removed (courtesy of Sanjiv Kumar, COLA)
Examples of Recent Findings • Ice cores have been extended back to 800 ka, which provides additional instances of the glacial-interglacial cycles of the Quaternary period • Recent trends in the Arctic unprecedented in last 2 ka • Recent trends in glacier retreat unprecedented in last 6 ka • Regional variations of warming trend at the surface, in the troposphere and in the stratosphere are better estimated • Urban heat island effect is at most 10% of trend • Detection and attribution of climate change – e.g. separating anthropogenic signal from natural variability – has improved considerably, due mostly to improvement in models
Center of Ocean-Land-Atmosphere studies (Net) Global Warming • Warming • 1. Greenhouse gases (CO2, CH4, N2O) • CO2: Carbon Dioxide : Emission from fossil fuel • CH4: Methane : Agriculture • N2O: Nitrous Oxide • 2. Land use change • Cooling • Aerosols • Man made/Natural • Volcanoes ※Rate of increase of GHG is largest in 10,000 years
Center of Ocean-Land-Atmosphere studies Increase in Surface Temperature Observations Predictions with Anthropogenic/Natural forcings Predictions with Natrual forcings 1.0º C IPCC 2007
Center of Ocean-Land-Atmosphere studies Projection of Global Warming Mean of 15 Models Surface Air Temperature Difference (Sresa1b YR 71-100) minus (20c3m 1969-98), Global Average = 2.61
Center of Ocean-Land-Atmosphere studies Observed & Projected Global Mean Warming
Center of Ocean-Land-Atmosphere studies Global Mean Sea Level Relative to the 1980 to 1999 mean
Center of Ocean-Land-Atmosphere studies Global Warming is Real and Unequivocal • Rising Temperatures (land, ocean) • More Hot Days; Less Frost Days • Melting Glaciers and Arctic Sea Ice • Decreasing Winter Snow Cover • Rising sea level • Poleward and Northward Shift of Species
Center of Ocean-Land-Atmosphere studies Summary of Major Impacts • Heat waves; Droughts; Forest fires • Coastal area’s habitability (sea level) • Health (cholera; malaria; dengue; lyme) • Biodiversity: extinction of species • Agriculture (uneven); Tropics (serious) • Water (drying; snow melt; glacier melt)
Elevated night time temperatures magnify bark beetle impact ‘Rapid Warming’ Spreads Havoc in Canada’s Forests Wednesday, March 1, 2006 QUESNEL, B.C. -- Millions of acres of Canada's lush green forests are turning red in spasms of death. A voracious beetle, whose population has exploded with the warming climate, is killing more trees than wildfires or logging. Source: D. Struck 3/1/2006, Washington Post, pA1
Center of Ocean-Land-Atmosphere studies Adaptation & Mitigation • Adaptation: initiatives and measures to reduce the vulnerability of natural and human systems against actual or expected climate change effects. • Mitigation: actions to reduce greenhouse gas emissions and to enhance sinks aimed at reducing the extent of climate change.
Center of Ocean-Land-Atmosphere studies Mitigation Geoengineering • Inject sulfur particles into the upper atmosphere reflect solar radiation (Volcanoes) • Spray sea water increase reflectivity of marine stratus clouds reflect solar radiation (1500 ships ~ increase reflectivity by 10%) • White roof tops
Geoengineering : Reducing the amount of carbon in the atmosphere • Expose the atmosphere to chemicals • To convert CO2 as solid form 2. Reduce amount of sunlight reaching Earth • Inject sulfur particles into the upper atmosphere reflect solar radiation (Volcanoes) • Spray sea water increase reflectivity of marine stratus clouds reflect solar radiation (1500 ships ~ increase reflectivity by 10%) • White roof tops
Center of Ocean-Land-Atmosphere studies STERN REVIEW: Main threat to a sustainable Earth • Damages from business-as-usual scenario would be at least 5% and up to 20% of Global GDP a year • Costs of removing most of the climate risk are around 1% of GDP per year • This is equivalent to paying on average 1% more for what we buy • “We can grow and be green” Sir Nicholas Stern
Center of Ocean-Land-Atmosphere studies What We Can Do (Individuals; Institutions; Governments) • Immediate action on conservation and energy efficiency • Help elect enlightened leaders and policymakers • Educate the public • Social, economic, scientific, technological research • Create new institutions • International dialogues and negotiations • Tax; Cap and Trade
Center of Ocean-Land-Atmosphere studies The Global Challenge Global Well-Being (sustainability, security and the future of civilization) Environmental Degradation Inequality and Extreme Poverty Human Population Growth
Tobacco and Health(Denial by Industry) • Understood the effects of tobacco on health (~1920 s) • Surgeon general puts warning label (1965) • Changes in policies and practices (~1990 s) • Global Warming • Funding of “doubt” by oil, coal and auto industries.
A Movement Because climate change seriously threatens the habitability of Earth and the sustainability of our societies and the planet’s ecosystems, and because a powerful industrial-political coalition opposes actions to address climate change, the younger generation must start a movement to take back the Earth.
Center of Ocean-Land-Atmosphere studies Sustainable Development “The balance of economic growth, social justice, and environmental health that meets the needs of present generation and enables future generations to meet their needs.” Our Common Future (1987) The Brundtland Report
Center of Ocean-Land-Atmosphere studies Yes Managing planet Earth…… A new phase in human history An enormous challenge…… Are we up to it? THANK YOU!
Sustainability at GMU • GHG footprint: dorms; colleges; GMU • Utilization of water and energy: (energy sources; coal, natural gas, nuclear, etc.) • Collection and dissemination of data; Innovative solutions • Conservation competition among dorms/colleges; among Washington area universities • Environmental advocacy; lectures at high schools, public events • Greening of the campus (bike sharing; commuting; food services) • Exposure to: science, engineering, economics, politics, policy, health, law, art, architecture, etc.
Center of Ocean-Land-Atmosphere studies THANK YOU! ANY QUESTIONS?
Climate and Malaria • Temperature dependence of malaria vector well known to researchers in the 1920s (e.g., A. Macdonald, Journal of the Royal Army Medical Corps) • Maximum altitude and latitudinal range strongly determined by mean temperature • Interactions between pathogen, vector, host, and climate are complex and not fully understood • Weaker links between disease incidence and climate within endemic regions • Vectors are subject to significant control measures in developed world – good for human health, but confounds link to climate.
Malaria in Kutch, NW India (November Peak)lagged rank correlations (black line = 95% confidence) JAS Rainfall JAS Temp. June SST
Cholera in Bangladesh • Cholera • Pathogen (vibrio cholerae) inhabits aquatic environments • Fecal-oral transmission • Ingestion of contaminated water • Numerous pandemics throughout history • Multiple strains: El Tor • Bangladesh • Endemic center of cholera • Low-lying • Densely populated • Delta of two major rivers courtesy ICDDR, B
Influence of Climate? • Vibrio cholerae is an aquatic organism • Water level, temperature, salinity, nutrients, all can influence prevalence of V. cholerae and potentially disease incidence • Interactions between disease, host and climate are complex and poorly understood • Role of climate still uncertain Understanding links in the current climate is critical to understanding cholera risk in a changing climate
Cholera Annual Cycle: Bangladesh Monsoon Prominent seasonal dependence - Link to monsoon?
Statistical Analysis … Rank Correlation of September Cholera Incidence with Antecedent January Sea Surface Temperature Bangladesh Strong resemblance ENSO warm phase
… Reproduced by Climate Model Direct influence on cholera? • Observed precipitation enhanced following El Niño • Model captures much of the observed signal Plausible link between cholera and ENSO