Download
1 / 15
150 likes | 225 Views
Analyzing HAB data for supporting Chlorophyll Criteria Development Peter Tango Maryland Department of Natural Resources. Methods. Visual analysis relative to published HAB thresholds for living resource or human health effects. Statistical approaches.

E N D
Analyzing HAB data for supporting Chlorophyll Criteria Development Peter Tango Maryland Department of Natural Resources
Methods • Visual analysis relative to published HAB thresholds for living resource or human health effects. • Statistical approaches
What conditions do we need to achieve to reduce the likelihood of a cyanobacteria bloom? bloom ~ 1,700 colonies /ml or 10,000 cells/ml
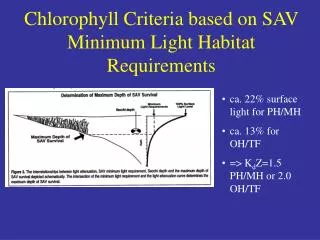
Brown Tide: Coastal Bays Polyhaline example • If we are talking about a max of 5 ug/L to eliminate risk of Brown Tide, then we are likely talking about means or medians in the 1-3 ug/L region, allowing for natural variability. • Marine oligotrophy: < 1ug/L, mesotrophy 1-3 ug/L, eutrophy 3-5 ug/L (Smith et al 1999) • Molvaer et al. 1997: oligo < 2 ug/L, meso 2-7, eutro > 7 ug/L.
Statistical Approach: Odds Ratio • Odds of a bloom for a particular CHLA threshold were developed for Prorocentrum minimum in Maryland waters. • Odds = # events (bloom samples)/# nonevents (nonbloom samples) for all data less than or equal to the threshold. • Probability of a bloom = odds/(1+odds). • Max probability of a bloom = bloom samples/ total samples ~ 11% or 1 in every 9 spring samples is expected to contain > 3000 cells/ml. • Spring = March-May.
Blue diamonds are bloom probability when data are contained a chosen CHLA threshold. Red squares are the % maximum potential bloom levels. (the overall level in the Bay, regardlessof CHLA is 1 in 9 samples or 11% of samples will contain a bloom level of Prorocentrum in spring.)
Narrow range of chla that lacks potential for blooms. 0-5 ug/L.
Response slope continues declines above 30 ug/L as we approach the maximum probability for bloom potential somewhere near 100 ug/L.
Prorocentrum summary • < 5ug/L CHLA has probability of 0 for Prorocentrum blooms in spring. • Prorocentrum has a steep response curve to increasing CHLA. • *IF* this curve portends P.minimum response to reducing CHLA in the Bay as well, then response rates will improve the more we reduce CHLA levels. • The higher the initial CHLA level, the slower the initial response from the maximum bloom potential we have observed in the Bay as we reduce CHLA levels.
Examples of published trophic status classifications Freshwater: Eutrophic >10 ug/L (Wetzel 2001) 6.7-31 ug/L (mean) (Ryding and Rast 1989) 9-25 ug/L (Smith et al. 1999) Phytoplankton Reference Communities: Spring median: 4.3 (1.0 – 13.5) Summer median: 8.6 (3.2-15.9) Polyhaline: Good Conditions Historical Ches Bay Annual mean: 0.46-1.21 (Harding and Perry 1997) Olson 2002 Spring mean 3.9 ug/L Summer mean 3.2 ug/L Phyto Reference Communities Spring 2.9 median (1.1-6.7: 5-95%) Summer 4.4 median (1.7-8.7:5-95%)
Summary • Published HAB thresholds provide a mechanism for comparison with CHLA levels providing insight into controlling their concentrations. • Concentrations limiting blooms thus far show similarity with published trophic status boundaries • Certain approaches may provide a means to gauge cost-benefit relationships linked with bloom probabilities