Download
1 / 36
360 likes | 501 Views
Pipeline Subcommittee. supporting data. June 29, 2010 DRAFT. Table of Contents. P-20 General Demographics P-12 Public School Students in CO 4 Location of P-12 Students 5 P-12 Colorado Public School Students 6 10-Year Change in P-12 Ethnic Pop. 7 P-12 Demographics by Region 8

E N D
Pipeline Subcommittee supporting data June 29, 2010 DRAFT
Table of Contents P-20 General Demographics • P-12 Public School Students in CO 4 • Location of P-12 Students 5 • P-12 Colorado Public School Students 6 • 10-Year Change in P-12 Ethnic Pop. 7 • P-12 Demographics by Region 8 • High School Graduation Rates 9 • 10-Year Change in P-12 Pop & HS Grad Rates 10 • GED Candidates 11-12 • PS Enrollment at Public and Private Inst 13 • Location of Public PS Students 14 • Ethnic Distribution by Inst and Pell Eligibility 15 • Student Persistence & Retention Rates 16 • Student Persistence by Ethnicity/Gender 17 • Graduation Rates at 2-Year Institutions 18 • Graduation Rates at 4-Year Institutions 19 • Secondary/Postsecondary Pipeline 20 • Pipeline by Ethnicity 21 Remediation • Remediation Rates by H.S. Region 23 • Remediation Rates by Subject 24 • Remediation Rates by Ethnicity 25 • Remediation Rates by Course 26 • Graduation Rates by Remedial Course 27 Accelerated Learning • Accelerated Learning by Ethnicity 29 • Advanced Placement Participation and Perf. 30 • Advanced Placement Course Completion 31 ACT Success Rates/Assessing College Readiness • Impact of State-wide ACT Testing 33 • % of CO students ready for College 34 • CO Regions meeting all ACT Benchmarks 35 • Comparison of CO ACT Tested Juniors, Before and After State Testing 36
P-12 Public School Students in Colorado Fall 2009 Total # of P-12 Students in Colorado = 832,368
Location of P-12 Students throughout Colorado Fall 2009 Total # of Public P-12 Students = 832,368 Total # of Homeschoolers = 6,501
P-12 Colorado Public School Students - Fall 2009 832,121 700,955 84% of P12 students live along the I-25 corridor. What are the implications for service delivery? P-12 students living along I-25 corridor P-12 students in CO public schools
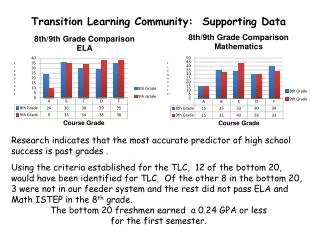
P-12 Demographics by Region 2009 *Graduation rate is based on 2005-06 9th grade cohort and adjusted for students transferring in or out of original district.
High School Graduation Rates 2009 Graduating Class Total Students: 63,585 Total Graduates: 47,459 Overall Graduation Rate: 74.7% *Total Students and Graduation Rates are based on 2005-06 9th grade cohort and adjusted for students transferring in or out of original district.
10-Year Change in P12 Ethnic Population & High School Graduation Rates 82% of White Students Graduate 2.5% h 33,272 out of 40,451 Graduate 61% h 58% of Hispanic Students Graduate H.S. 9,364 out of 16,202 Grad. 64% of Black Students Graduate H.S. 23% h 2,619 out of 4,070 Grad. Latinos represent the largest growth of P12 students with the lowest high school graduation rates. How do we increase postsecondary enrollment rates for all, especially ethnic minority students? *Graduation rate is based on 2005-06 9th grade cohort and adjusted for students transferring in or out of original district.
GED Candidates by Age, Ethnicity, and Gender 2008 Total Candidates Tested – 15,629 Total Completers – 11,678 Total Candidates who Passed – 9,724 Male Candidates – 59.9% Female Candidates – 40.1%
GED Candidates by Region 2008 7,520 15,701 Students Tested 11,662 Passed 74.3% Overall Pass Rate 3,444 72% 1,601 79% 1,202 1,106 513 303 12 83% 69% 81% 75% 75% 60%
Postsecondary Enrollment at Public and Private Institutions Fall 2008 Public Institutions Private Institutions Students at Public Institutions 219,859 Students at Private Institutions 155,309 Total students enrolled in Postsecondary education as of Fall 2008 = 375,168
Location of Public Postsecondary Students Fall 2008 87% of postsecondary students are enrolled in colleges along the I-25 corridor. I-25 Corridor Total Students Enrolled
Ethnic Distribution by Institution and Pell Eligibility Fall 2008 29% of students at a CO public institution are Pell eligible.
Student Persistence and Retention Rates at Colorado 4-Year Public Institutions Fall 2003 – Spring 2009 Year 13 Year 14 18,675 Students Begin College Year 15 Year 16 Year 17 and beyond 13,911 Students Begin 2nd Year (2 graduate) 11,320 Students Begin 3rd Year (6 graduate) 75% 81% 91% 93% 9,687 Students Begin 4th Year (563 gradate) 2,960 Students Begin 5th Year (6085 gradate) 2,553 Continue The most probable time for students to dropout of higher education is during or at the end of their first year of enrollment, shown here as a 25% decline in enrollment between year 13 and 14. As students persist, the likelihood of continuation toward graduation increases each year. If students can persist beyond their 2nd year, they have a very high likelihood of graduating.
Student Persistence Between Year 13 and 14 at Colorado Public Institutions by Ethnicity and Gender Fall 2007 – Fall 2008 Non-Resident Alien Unknown Ethnicity Unknown Ethnicity Native American Native American Non-Res Alien Hispanic Hispanic Female Female White White Black Asian Asian Black Male Male Persistence between Year 13 and 14 is a strong indicator of the likelihood of graduating from college. Increasing persistence rates directly increases graduation rates.
Graduation Rates at 2-Year Public Institutions Spring 2008 Average graduation rate at 2-Year institutions is 25.4%. Includes students receiving Associate degree or Certificate at either original or transfer institution, but only includes 2-Year to 2-Year transfers. Graduation rates for those transferring to 4-Year institutions is not shown here. Cohort is for 1st time High School graduates, ages 17-19, and degree-seeking students only.
Graduation Rates at 4-Year Public Institutions Spring 2008 Average graduation rate At 4-Year institutions is 57.7%. Cohort is for 1st time High School graduates, ages 17-19, and degree-seeking students only.
Secondary/Postsecondary Pipeline (Statewide) Only 26% of the original 9thgrade cohort received a degree within 6 years of beginning college. 24,340 4-Year (18,186) 28% of 1st Time students. 12,088 6,839 4-Year (10,486) (3,384)
Secondary/Postsecondary Pipeline by Ethnicity Fall 2003 Spring 2009 14,585 Begin 4-Year Public College 8,849 (61%) Graduate Within 6 Years 39% 24% Fall 1999 Spring 2003 27% of original White cohort received a college degree. 37,137 Begin High School 32,495 Graduate from High School White 88% Fall 2003 Spring 2006 5,129 Begin 2-Year Public College 1,214 (24%) Graduate Within 3 Years 3% 14% 419 Begin 4-Year Public College 174 (42%) Graduate Within 6 Years 17% 7% 9% of original Black cohort received a college degree. 2,408 Begin High School 1,849 Graduate from High School Black 77% 443 Begin 2-Year Public College 57 (13%) Graduate Within 3 Years 2% 18% 1,637 Begin 4-Year Public College 732 (45%) Graduate Within 6 Years 18% 8% 11% of original Hispanic cohort received a college degree. 9,009 Begin High School 6,270 Graduate from High School Hispanic 70% 1,285 Begin 2-Year Public College 238 (19% Graduate Within 3 Years 3% 14% * Only includes students entering a Public 2 or 4 Year Institution.
Remediation Rates by High School Region Fall 2008 - 1st Time College Students Average remediation rate across the state is 28.5%. Total Students
Remediation Rates by Subject (All Public Colleges) Fall 2008 12% of 1st time college students are taking remedial Reading 23% of 1st time college students are taking remedial Math 17% of 1st time college students are taking remedial Writing Indicates percentage of total students per subject, based on cohort of 29,704 1st time college students.
Remediation Rates by Ethnicity Fall 2008 % of total students
Remediation Rates by course 1st time College Students - Fall 2008 6.7% % of all 1st time undergraduate students 5.3% 3.8% 3.5% 3.1% 2.1% 1.6% 0.4% 0.3%
Graduation Rates for Community College students enrolled in Remedial Math 030, 060, and 090 Math 030 Cohort: 100% 72% 62% 46% 36% 25% 13% 8% 4% 1662 Enroll MAT 030 1189 Complete MAT 030 1031 Enroll MAT 060 761 Complete MAT 060 591 Enroll MAT 090 409 Complete MAT 090 220 Enroll MAT 090 137 Complete College Math 61 Graduate 100% 75% 54% 36% 24% 17% 8% 2908 Enroll MAT 060 2171 Complete MAT 060 1562 Enroll MAT 090 1040 Complete MAT 090 693 Enroll MAT 090 499 Complete College Math 222 Graduate Math 060 Cohort: 100% 68% 35% 26% 12% 2363 Enroll MAT 090 1604 Complete MAT 090 833 Enroll MAT 090 603 Complete College Math 275 Graduate Math 090 Cohort: Each additional remedial math course that is required decreases a student’s chance of graduating with an Associates Degree by 4%. Graduation rates for Math 030, 060, and 090 students are 4%, 8%, and 12%, respectively.
Accelerated Learning by Ethnicity 2008–09 School Year Student Headcount TBD
Advanced Placement Participation & Performance 2009 Graduating Class Total Graduates Unknown Total Graduates Unknown
Advanced Placement Course Completion 2009 Graduating Class
The impact of State-wide ACT Testing on College Enrollment • 13% of Colorado students who had not planned to attend college at the time of testing ended up enrolling in college the next year. • From 2002 to 2007, the percentage of CO high school grads enrolled in college the following fall increased by 1 percentage point. • More males, minority students, middle and lower income students, and first-generation students took the ACT, which resulted in more opportunities to increase access and participation.
Percent of CO students ready for College-Level Coursework (Based on ACT scores for 2009 Graduating Class) A benchmark score is the minimum score needed on an ACT subject-area test to indicate a 50% chance of obtaining a B or higher or about a 75% chance of obtaining a C or higher in the corresponding credit-bearing college course.
% By Colorado Region Meeting All ACT College Readiness Benchmarks % Meeting Benchmark A benchmark score is the minimum score needed on an ACT subject-area test to indicate a 50% chance of obtaining a B or higher or about a 75% chance of obtaining a C or higher in the corresponding credit-bearing college course.
Comparison of Colorado ACT-Tested Juniors Before and After State Testing