Download
1 / 17
170 likes | 288 Views
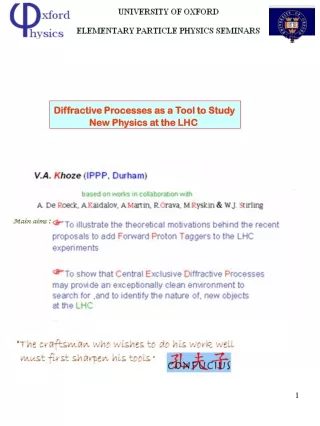
GALEX measurements of the Big Blue Bump as a tool to study bolometric corrections. Elena Marchese R. Della Ceca, A. Caccianiga, P. Severgnini, A. Corral. Active Galactic Nuclei 9 – Ferrara , 24-27 May 2010. Accretion rate density. Total accreted mass.

E N D
GALEX measurementsof the Big BlueBumpas a tooltostudybolometriccorrections Elena Marchese R. Della Ceca, A. Caccianiga, P. Severgnini, A. Corral Active Galactic Nuclei 9 – Ferrara , 24-27 May 2010
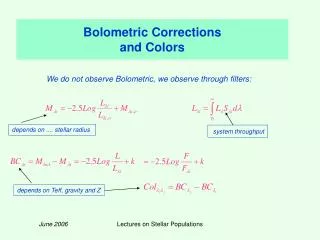
Accretion rate density Total accreted mass Active Galactic Nuclei, powered by accretion onto a Super-massive Black Hole (SMBH), emit over the entire electromagnetic spectrum with the peak of the accretion disk emission in the far-UV, a wavelength range historically difficult to investigate. • Study the spectral energy distribution (SED) of type 1 AGN in the optical, Near and Far-UV and X-ray energy bands . • Constrain the luminosity of the accretion disk emission component • Derive the hard X-ray bolometric correction factors for a significant sample of Type 1 AGN spanning a large range in z and Lx.
The XMM-Newton Bright Survey in pills XMM fields used: 237 Covered Area (deg2): 28 Sources in the bright sample(BSS,0.5-4.5keV): 389 “ “ “hard” bright sample(HBSS,4.5-7-5 keV): 67 (56sources are in common) Total Sources: 400(fx>~7x10-14 erg cm-2 s-1) Della Ceca et al., 2004 Caccianiga et al., 2008 The starting point of our study is a sample of 304 AGNs, counting 263 type 1 AGNs having intrinsic NH <4 ·1021 cm-2, belonging to the XMM-Newton Bright Serendipitous Survey (XBS).
The GALEX mission in pills GALEX (Galaxy Evolution Explorer) is a NASA Small Explorer mission that is performing surveys of different depths/sky coverage in the far-UV and near-UV
The sample 263 X-ray selected AGN 1, with NH <4 ·1021 cm-2 CROSS CORRELATION WITH GALEX 40 sources out GALEX field 63 upper limits 160 matches • All these sources have an X-ray spectra from XMM-Newton which allows us to derive X-ray luminosities and spectral properties (e.g. Γ, Nh). • Corral, Della Ceca, Caccianiga and Severgnini, 2010, in preparation • A. Corral:this meeting CROSS CORRELATION WITH SDSS 82 sources having data from XBS-GALEX-SDSS
The model • The data points from the SDSS and from GALEX were described using a basic accretion disk model (DISKPN model in the XSPEC package). The maximum disc temperature was chosen in the range kT≈1-64 eV , and the normalization has been left has free parameter.
Correctionstomeasuredfluxes Host Galaxy Our Galaxy AGN Hydrogenclouds (Lymanαforest) Intrinsic AGN reddening The exact shape of the extinction curve in the Near-Far-UV is still a matter of debate Observer Galacticreddening: Allen law(1976) Rv =3.1 EB-V = AB – AV available from the GALEX database Gaskell e Benker, 2007 determined a parametrized average extinction law from the study of 14 AGN, with FUSE and HST data. Bohlin et al. 1978
Corrections to measured fluxes- IVOptical emission from the host galaxy SED OF ONE OF THE SOURCES About 20% of the sourceshaveopticalSEDsshowing a hardening at the opticalwavelengths. Opticalspectraofthesesourcescontaminationby the stars in the hostgalaxy SDSS GALEX AGN + hostgalaxy FLUX Calcium break ENERGY (kev) Break at 4000 Å : indicatorofthe importanceof the galaxy star-light in the total emissionof the source. Hostgalaxy AGN F+ e F-meanfluxdensities in the regions4050-4250 Å and 3750-3950Å (in the source rest-frame) respectively. Calcium- break
Corrections to measured fluxes- IVOptical emission from the host galaxy Modelformulatedtocorrectfor the emissionof the hostgalaxy • Modelof a normalgalaxy: HeavisidefunctionsuchthatΔ=50% Ca break≈40% • Wecalculated the resultingΔfrom the combined emission of the AGN (with different normalizations) and host galaxy H.GALAXY+AGN • AGN: αν =-0.44 (αλ =-1.56). • (Vanden Berk et al. 2001) HOST GALAXY FLUX AGN λ (Å) H. GALAXY+AGN FLUX RATIO AGN/GALAXY FLUX AGN HOST GALAXY Break at 4000 Å λ (Å) Ca break≈2%
BEFORE CORRECTION AFTER CORRECTION Δ=17.3% GAL+AGN AGN SDSS GALEX FLUX SDSS GALEX HOST GALAXY 0. 0. FLUX ENERGY(keV) ENERGIA (keV) ENERGY (keV) Δ=33.2% SDSS GAL+AGN FLUX SDSS FLUX GALEX GALEX 0. HOST GALAXY AGN ENERGY (keV) ENERGY (keV)
Corrections to measured fluxesEmission lines contribution The presenceofemissionlineswithin the filterbandpass can contributesignificantlyto the observedmagnitudesofan AGN. Sincethiseffectis a strong functionofredshift, weneedto take itinto account to derive the continuum… TIPICAL SPECTRA OF AN AGN Assuming R ~1 FLUX WAVELENGTH (Å) Averagespectra and equivalentwidthsof the emissionlinespresent in the energybandswe are studying, calculatedbyTelferet al. 2002, from the spectraof 184 quasarswith z>0.33 .
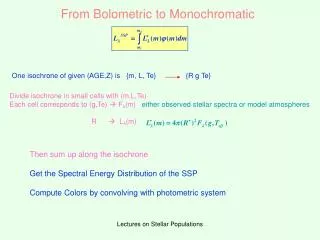
SPECTRAL ENERGY DISTRIBUTIONS OPTICAL-UV FLUSSI OTTICO-UV FLUSSI OTTICO-UV FLUSSI OTTICO-UV OPTICAL-UV X-ray (XMM) X-ray XMM FLUSSI X FLUSSI X FLUSSI X ENERGIA (keV) ENERGIA (keV) ENERGIA (keV) ENERGIA (keV) ENERGIA (keV) Medianmaximum temperature : kT ≈ 4 eV
Availableforeveryobjectfrom the X-rayspectralanalysis (Corralet al. 2010) 2-10 keVluminosity Extrapolatedfrom the 2-10 keVluminosity, using the spectalindexmeasuredforeverysorce 0.1-100 keVluminosity Accretion disk luminosity Calculatedas the integralof the SEDs in the optical-UVbands. L bol=Ldisc + L 0.1-100 keV
UV fluxes or their upper limits were fitted with the same model with a Tmax fixed to kT ≈ 4 eV 63 sources with XBS-GALEX upper limits 78 sources with XBS-GALEX data 82 sources with XBS-GALEX-SDSS data discussed so far
Results - I CORRELATION LDISK – L2-10keV Strong dependenceof the accretion disk luminositiesto the X-rayluminosities the twoemissionmechanisms are highlycorrelated 78 sources XBS-GALEX 82 sources XBS-GALEX-SDSS Best-fit bisector relation: In good agreement withpreviousresults on X-rayselectedsources: Lusso et al. 2010: β=1.31±0.038 63 sources XBS-GALEX upper limits
Results - II BOLOMETRIC CORRECTION AGAINST HARD X-RAY LUMINOSITY 63 sources XBS-GALEX upper limits 78 sources XBS-GALEX • We don’t find any significant correlation between bolometrc correction and X-ray luminosities • This is probably due to a very large spread in the distributions of the hard X-ray bolometric corrections, going from ~5 up to few hundred, implying a large dispersion in the mean SED 82 sources XBS-GALEX-SDSS
Conclusions We used a sample of 223 sources spanning a large range in X-ray luminosities(LX ≈1041 – 1046 erg/s) and redshift (z≈0-2.4) and we find : • A high correlation between the accretion disk luminosity and the X-ray luminosity, in agreement with previous works on X-ray selected AGNs. • A very large spread in the distributions of the hard X-ray bolometric corrections, going from ~5 up to few hundred -> a large intrinsic dispersion in the mean SED; Thank you