Download
1 / 19
190 likes | 276 Views
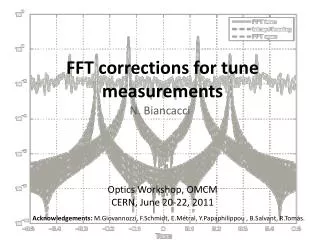
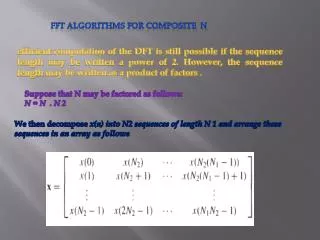
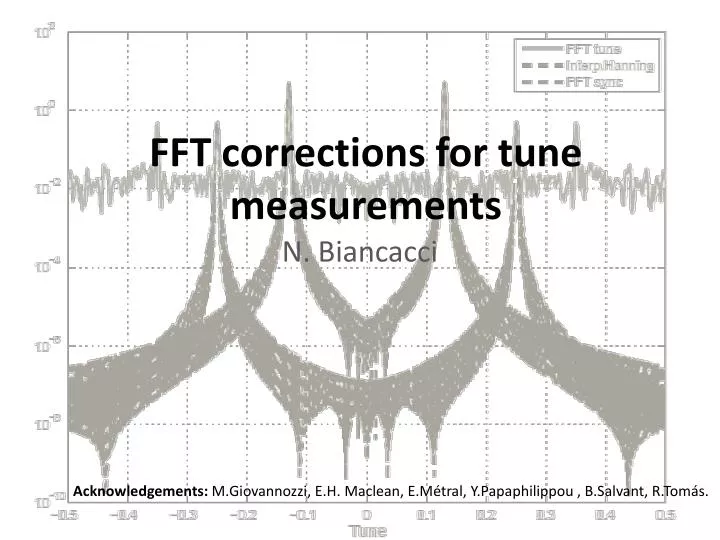
FFT corrections for tune measurements. N. Biancacci. Acknowledgements: M.Giovannozzi, E.H. Maclean, E.Métral, Y.Papaphilippou , B.Salvant, R.Tomás. Discrete fourier transform (DFT) of harmonic signals ApFFT -FFT corrected- SUSSIX

E N D
FFT corrections for tune measurements N. Biancacci Acknowledgements: M.Giovannozzi, E.H. Maclean, E.Métral, Y.Papaphilippou , B.Salvant, R.Tomás.
Discrete fourier transform (DFT) of harmonic signals ApFFT-FFT corrected- SUSSIX Comparisons between different operations on spectra in order to achieve higher resolution. Conclusion and outlook Outline
DFT on harmonic signals BPM = number of turns ADC Noise + Memory
Continuum case: DFT on harmonic signals
Discrete case: Having a finite number of samples corresponds to windowing with a “rect” function r[n] the sampled signal. DFT on harmonic signals This operation is a convolution in the discrete frequency domain. Applying the DFT formula on r[n] and applying translation property* from s[n], we get: * DFT translation property
Observations: DFT on harmonic signals Frequency shiftAmplitude distortion Phase shift Naming where m is the index corresponding to the highest peak in amplitude spectrum, one can see that Amplitude, phase and frequency resolutions depend on the error δ in localizing the spectrum maximum. Resolution in frequency is related to the length of samples but also to the value of δ (correspond to the real value if δ=0). Without correction, making the phase basically useless. Resolution in amplitude is dependent from the resolution in frequency and the window shape. m
To overcome these limits and recover the real parameters for the harmonic signals different methods were proposed*: CFFT ‘Corrected FFT’ Used to correct the amplitude, phase and frequency. Based on analytical properties of windowing functions. ApFFT ‘All phase - FFT’ Used to improve the phase resolution. Based on properly preprocessing the measured signal in order to cancel phase errors. Sussix Used to improve frequency resolution. Based on iterative routines to get the frequency of the tune. DFT on harmonic signals In the following we present comparisons between these three methods. * All references at the end of the presentation
Using a “rect” window we get a “sinc” shape in frequency domain. This window has a nice property if one computes the baricentre for two points in the main lobe of the sinc. Corrected FFT Take the continuum function . Take two points P1(x1,y1) and P2(x2,y2) in the main lobe. The baricentre is given by: If then: It follows that P1 P2 Since in spectral analysis, k-samples are spaced by unity, taking the shifted-maximum and the second maximum, and computing the baricentreXc we get the exact position corresponding to the real maximum:
Applying the baricentre method we can get the correction formula both for “rect” and Hanning window: Rect window Hanning window Corrected FFT m m-1 m+1 m m-1 m+1
This is a preprocessing algorithm developed to correct the phase got out from the DFT operation. The computed phase is the central phase, i.e. the one corresponding to the central sample in case of an odd number of samples. Ap-FFT Multiply the signal with a triangular window: Fold the windowed signal: Proceed to FFT evaluation and extract the phase: The phase is no more dependent on δ, i.e. doesn’t need to be corrected.
At the core of SUSSIX is a Fortran Routine TUNENEWT,developed by the Bologna Group in the mid-nineties (Author: A. Bazzani ; tests by R. Bartolini, M. Giovannozzi, & E. Todesco). • TUNENEWT determines the maximum of the amplitude of the FFT with an iterative Newton method.. • SUSSIX uses TUNENEWT to analyse the full frequency spectrum: • The fundamental frequencies are found and corrected using TUNENEWT: • Frequency ( k), Amplitude (ak), Phase (k) • Harmonic time series are built: • and subtracted from the original signal • The new signal z(n) – zk(n) is re-analysed with TUNENEWT... • The spectral lines are ordered, as linear combinations of the tunes, in decreasing amplitude. Sussix Courtesy of E.H. Maclean
Different simulations were set up on detecting phase, amplitude and frequency using the three different methods. In order to properly compare the phase accuracy, the phase difference between two signals at the same frequency will be analyzed. In real life the absolute phase has no sense cause to the decoherence in the signal. Comparisons All the simulations are set in presence of noise. The level is set in terms of power of noise: We consider the case of 0, -10, -100 dB. These values correspond to 100%, 30%, 0% the amplitude of a unitary sinusoid. Pn = -10dB Pn = 0dB Pn = -100dB
Pn = 0dB Frequency • Both FFT and Sussix have Hanning window on the signal. • The FFT is corrected with the formulae seen before. • Sussix does the correction in TUNENEWT iteratively. • ApFFT has a rect window and doesn’t implement any correction in frequency. Pn = -10dB Pn = -100dB
Screen clipping taken: 5/27/2011, 3:44 PM Pn = 0dB Amplitude • Neither Sussix nor ApFFT implement any amplitude correction. • The FFT is corrected with the formulae seen before. Pn = -10dB Pn = -100dB
Pn = 0dB Phase • This simulation is set up with a ∆φs=90⁰. • The FFT is corrected with the formulae seen before. • In presence of noise all the approaches give almost the same results. Pn = -100dB Pn = -10dB
Pn = 0dB Phase • This simulation is set up fixing N to 512 Turns and spacing the ∆φs from ∆φs =0⁰ to ∆φs =180⁰. • In case of no noise (simulations) ApFFT and the corrected FFT give higher resolution. Pn = -100dB Pn = -10dB
The problem of getting correct phase, amplitude and frequency out of a harmonic signal was analyzed. • Corrected FFT, ApFFT and SUSSIX algorithm were presented in both a theoretical and practical point of view . • We can improve SUSSIX speed implementing the analytical corrections (single shot corrections VS iterative loops). • We can improve the corrected FFT in order to detect subsequent armonics in the betatron signal. • We could also complete the comparison including the NAF algorithm. Conclusions and outlook
On SUSSIX • R. Bartolini, M. Giovannozzi, W. Scandale, A. Bazzani and E. Todesco “Precise measurement of the betatron tune ” Particle Accelerators, 1996, Vol. 55, pp. [247-256] /1-10 • R.Bartolini, M.Giovannozzi, W.Scandale , A.Bazzani, E.Todesco “Algorithms for a precise determination of the betatron tune” Biography On FFT corrections • X.Ming, D.Kang “Corrections for frequency, amplitude and phase in a fast fourier transform of a harmonic signal” Mechanical Systems and Signal Processing V. 10, 2, March 1996, Pages 211-221 On Ap-FFT • X. Huang, Z. Wang, L. Ren et al. “A novel High-accuracy Digitalized Measuring Phase Method” IEEE • X.Huang, Z.Wang, G.Hou “New method of estimation of phase, amplitude and frequency based on all phase FFT spectrum analysis” IEEE • X.Ming, D.Kang “Corrections for frequency, amplitude and phase in a fast fourier transform of a harmonic signal” Mechanical Systems and Signal Processing V. 10, 2, March 1996, Pages 211-221 On digital signal processing • J.G.Proakis, D.G. Manolakis “Digital Signal Processing, principles, algorithms and applications” 4th edition.