Download
1 / 25
250 likes | 329 Views
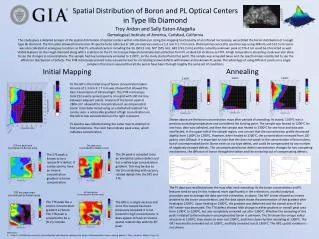
SPATIAL CORRELATION OF INFRARED AND PL OPTICAL CENTERS IN HYDROGEN-RICH DIAMONDS. Troy Ardon and Sally Eaton- Magaña Gemological Institute of America Carlsbad, CA USA. Geology of Marange. Samples sourced from Marange Alluvial deposit Unusually high amount of radiation damage

E N D
SPATIAL CORRELATION OF INFRARED AND PL OPTICAL CENTERS IN HYDROGEN-RICH DIAMONDS Troy Ardon and Sally Eaton-Magaña Gemological Institute of America Carlsbad, CA USA
Geology of Marange • Samples sourced from Marange • Alluvial deposit • Unusually high amount of radiation damage • Commonly found containing hydrogen clouds Image by Wuyi Wang
Hydrogen Clouds • Granular clouds of unknown structure and composition • Usually highly symmetric • Associated with infrared defect at 3107 cm-1 Image by Jian Xin Liao
Experimental Design • Flat plate with uniform thickness • Inscribed a series of points forming axes for accurate and reproducible mapping • Cloud shape thought to show strong contrast in features
Experimental Design • Infrared (IR) maps taken with Nicolet iN10 IR microscope on a grid with spacing of 100 μm and with an aperture size of 100 μm X 100 μm • Photoluminescence (PL) spectroscopy taken with RenishawinVia Raman Microscope with 488 nm, 514 nm, and 830 nm lasers on a grid with 500 μm spacing • Heated in a muffler tube furnace to temperatures of 300oC, 600oC, 800oC, 1000oC, and 1200oC for one hour at each step. • After heating to 1200oC, the fractures present developed and the sample broke apart.
IR mapping • Main features tracked were the A aggregates, 3123 cm-1 and 3107 cm-1 hydrogen related defect. • There was no detectable signal from B-aggregated nitrogen, indicating the formation temperature was likely below 1100oC[1] [1] Kiflawi et al., “The creation of the 3107 cm-1 hydrogen absorption peak in synthetic diamond single crystals,” Diamond and Related Materials 5 (1996) pp. 1516-1518
Infrared Spectrum of IaA type Diamond A aggregates (1280 cm-1) 3 N3VH (3107 cm-1) Absorbance (a.u.) 2 NVH (3123 cm-1) 1 0 2000 5000 4000 3000 1000 Wavenumber (cm-1)
A Aggregated Nitrogen C C C C C = Carbon N = Nitrogen C N C N C C C C C C C C
3123 cm-1 Defect C C C C C = Carbon N = Nitrogen V = Vacancy H = Hydrogen C V C N C H C C C C C C
3107 cm-1 Defect C N C C C = Carbon N = Nitrogen V = Vacancy H = Hydrogen N V C N C H C C C C C C
Temperature Variance of IR Defects 3107 cm-1 Defect A Nitrogen (1280 cm-1) 2.0 Natural Absorbance (a.u.) 1.0 After 1000oC 0.0
Proposed Mechanisms for Formation of N3VH + N V N N ? H N N ? + N V N H N V N H ? + N V N H N
PL mapping • Tracked peaks of known structure, H3 (503.2 nm), NV- (637.5 nm), H2 (986.2 nm) • Tracked peaks of unknown structure at 523.5, 612.4, 700.5, 926, and 948 nm • Most defects correlated with hydrogen rich areas • Largest increase in defect concentration between 600oC and 800oC (temperature range when vacancies become mobile)
N3 Defect C N C C C = Carbon N = Nitrogen V = Vacancy N V C N Not observed in either H-rich or H-poor areas, therefore not a contributor to N3VH C C C C C C C C
Proposed Mechanisms for Formation of N3VH + N V N N ? H N N ? + N V N H N V N H ? + N V N H N
H3 Defect C C C C C = Carbon N = Nitrogen V = Vacancy N V C N C C C C C C C C
H3 Area 600oC Natural (no heat) 300oC 1.20 4 4 4 4 4 Y (mm) Y (mm) Y (mm) 2 2 2 2 2 0 0 0 0 0 Intensity (arb. units) 2 4 2 4 2 4 2 4 2 4 X (mm) X (mm) 0.60 X (mm) 1200oC 800oC 1000oC 4 4 4 Y (mm) Y (mm) Y (mm) 2 2 2 0.00 0 2 4 0 0 X (mm) X (mm) X (mm) 2 4 2 4
Proposed Mechanisms for Formation of N3VH + N V N N ? H N N ? + N V N H N V N H ? + N V N H N
Analysis of IR Defect Distribution • Analysis was done along the Y coordinate at evenly spaced X coordinates • Confirmed visual analysis that showed an inverse correlation of A aggregated nitrogen with hydrogen clouds
Variance along the y-axis of defect concentrations Dashed lines show position of H clouds Peak Area (Scaled for reference) Y Position (μm)
Evidence for Formation Mechanism • Other formation pathways unlikely due to absence of defects • Inverse correlation of A nitrogen shows that A nitrogen is likely depleted during formation of N3VH • Formation pathways involving three or more defects combining likely energetically unfavorable
NV- Centers PL Spectrum of Hydrogen Poor Area (taken with 514 nm laser) • Only defect noted to be elevated in H poor areas • The neutral counterpart (NV0) was not detected Diamond Raman Peak 552 nm Liquid Nitrogen Artifact Intensity (counts) NV0 575 nm (Absent) NV- 637 nm Wavelength (nm)
NV- Centers 600oC Natural (no heat) 300oC 2.00 4 4 4 Y (mm) Y (mm) Y (mm) 2 2 2 0 0 Intensity (arb. units) 2 4 0 2 4 2 4 X (mm) X (mm) 1.00 X (mm) 1200oC 800oC 1000oC 4 4 4 Y (mm) Y (mm) Y (mm) 2 2 2 0.00 0 0 0 4 2 2 4 2 4 X (mm) X (mm) X (mm)
Conclusions and Future Investigations • A-type nitrogen combining with NVH likely formation pathway for N3VH • Many defects of unknown structure correlated with hydrogen-rich areas • Use samples with minimal fractures to push to higher temperatures