Download
1 / 38
380 likes | 522 Views
Optical Identification of Infrared Sources in the AKARI NEP Survey Field. Hyung Mok Lee Seoul National University In collaboration with Seong Jin Kim, Yiseul Jeon , Myungshin Im + NEP team. I am going to talk about…. Introduction to AKARI NEP-Wide Survey: introduction and data reduction

E N D
Optical Identification of Infrared Sources in the AKARI NEP Survey Field HyungMokLee Seoul National University In collaboration with Seong Jin Kim, YiseulJeon, MyungshinIm + NEP team
I am going to talk about… • Introduction to AKARI • NEP-Wide Survey: introduction and data reduction • Confirmation of sources • Optical/NIR identification • Cross-identification within AKARI bands • Summary and suggestion Maidanak User's Meeting 2
The AKARI (ASTRO-F) Project • IR Space Mission by Japan Aerospace Exploration Institutes (JAXA)/Institute for Space and Aeronautical Science (ISAS) with ESA support • Collaborative Institutes in Japan: - University of Tokyo - Nagoya University - Communications Research lab. - National Astronomical Observatory (NAOJ) • International Collaboration - Seoul National University (Pre- and post-flight simulations/data reduction) - European Consortium (Imperial, Open Univ., Sussex, Groningen: data reduction) Maidanak User's Meeting 2
Telescope • Mirror • 68 cm, F/6 • SiC • Cryogenic System • 170 liter LHe + Stirling Cooler • T(tel) = 5.8 K, • T(detector) = 1.8 K (st. Ge:Ga), 15 K (InSb) Maidanak User's Meeting 2
Focal Plane Instruments • IRC: Near- and Mid-IR Camera • FIS:Far-IR Surveyor Maidanak User's Meeting 2
Orbit and Observing Modes • Sun Syncrhonous Orbit with a=7081.093 km e=0.002102013 Altitude ~ 750 km • Orbital Period ~100 minutes • Max Pointings3 / revol. • Pointing Obs. < 10 min per pointing The telescope visits NEP and SEP in every orbit!
Features • Main purpose: all sky survey in mid to far infrared + pointing observations • Higher resolution compared to IRAS (e.g., 0.5-0.8’ compared to 6’ at far IR) • Wide field of view (10’ x 10’ for IRC) • Wide and continuous wavelength coverage from near to far IR (2-170 microns) for both wide-band imaging and spectroscopy • Scientific programs include all sky survey, large area surveys (NEP, SEP), Mission Programs, and open time programs Maidanak User's Meeting 2
FIS All Sky Survey: Version 1. • Release of Bright Source Catalogue Version 1 on March 30, 2010 (available at http://www.ir.isas.jaxa.jp/ASTRO-F/Observation/PSC/Public/) • Catalogue at a glance (cf, IRAS PSC has ~ 250,000 sources) Maidanak User's Meeting 2
Far Infrared Survey: 65 mm Maidanak User's Meeting 2
Far Infrared Survey: 90 mm Maidanak User's Meeting 2
Far Infrared Survey: 140 mm Maidanak User's Meeting 2
Far Infrared Survey: 160 mm Maidanak User's Meeting 2
MIR Survey: 9 mm • ~844,600 sources Maidanak User's Meeting 2
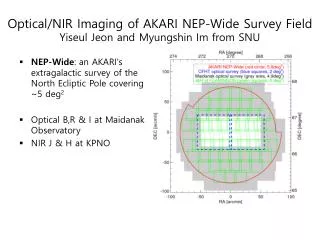
NEP Surveys • One of the Large Area Surveys of AKARI because of high visibility • Consists of Deep (0.38 sq. deg) + Wide area (5.8 sq. deg.) surveys (Matsuhara et al. 2006) • Covered by 9 NIR and MIR bands of AKARI’s IRC (2-24 mm) • Other wavelength data: - Optical surveys that include the NEP Deep area are done with CFHT (Hwang et al. 2007) and Subaru Suprimecam - Optical survey for the entire NEP Wide survey area has been carried out using 1.5 m Telescope at Maidanak Observatory by SNU team (to be reported by YiseulJeon tomorrow) + Ground based NIR (J, H, K) data - Radio survey with WSRT at 20 cm has been carried out by Open Univ. team . Maidanak User's Meeting 2
NEP Survey Area Green: Wide Pink: Deep Yellow: CFHT Optical Survey Maidanak User's Meeting 2
Survey Strategy NEP-Wide CFHT NEP-deep Maidanak User's Meeting 2
Uniqueness of NEP-Wide Spitzer has a gap here. • Wide area survey with continuous wavelength coverage from 2 – 24 micron (aside from optical data) cf: SWIRE survey of Spitzer: IRAC + MIPS has a gap at 8-24 micron Onaka et al. 2007 Maidanak User's Meeting 2
Band merged mage : N2+N3+N4+S7+S9+S11+L15+L18 97060 sources are detected Maidanak User's Meeting 2
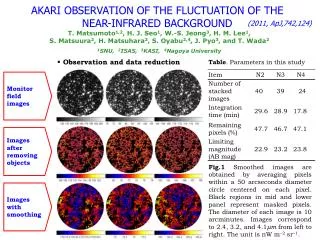
Problems of the AKARI Images There are many fake objects! • many of them are due to the MUX-bleedings around extremely • bright objects, andthey’reserious in NIR (sometimes in MIR). Ex. N2 N3 N4 Colored circles are mostly fake objects: they do not have any optical counterpart
How to remove fake objects? generate mask image & weight map ! make a map to give different weight depending on the region. give no weighton the MUX-bleeding area we want to remove. org image data mask image N_comb - pl file final map X = ex 1 : 2110506 example image (= individual pointing data) Region to be masked Region to be masked pl file from the pipeline (the number of rejected frames) final weight map for mosaic (SWarp) We have too abandon this dark (black) area a schematic view showing how to make a final weight map How to choose the masking area?
How to define the masking region find the extremely bright sources and trace the MUX-bleeding effectively photometric test for individual pointed observation in order to decide the masking region for each frame, we did SExtraction for both (before/after cosmic-ray rejection) cases and used the results a single frame hit by cosmic-ray after the correction (cosmic-ray rejection) colored ellipses indicate the sources brighter than 12.6thmag(AB) we can see what happened during the procedure of cosmic-ray rejection (LA-cosmic) and how we should make a mask image for each individual frame
result (comparison) the previous results “previous version of N2 mosaic image, ” PREVIOUS before vs after this operation ( mosaic images are generated using SWarp )
result (comparison) the final stage “updated result of the same region & final weighted map” FINAL SWARP parameter -BLANK_BADPIXELS Y -COMBINE_TYPE WEIGHTED -WEIGHT_SUFFIX . weight.fits before vs after this operation ( mosaic images are generated using SWarp )
Region masking of MIR We masked most of the bright stars manually one by one ! Representative Cases
Final Mosaic of S7 We removed the influence from bad data and the bright stars ! after vs before this work
Final Mosaic of S9W We removed the influence from bad data, the bright stars & bean-pattern, too ! after vs before this work
Final Mosaic of S11 We removed the influence from bad data, the bright stars & bean-pattern, too ! after vs before this work
Confirmation of sources with optical images • We have optical imaging data with CFHT (inner 2 sq. deg.) and Maidanak • CFHT field: u*,g’,r’,i’,z’ (Hwang et al. 2007) • Maidanak field: B, R, I filters (Jeon et al. 2010) • Near IR sources are likely to have optical counterparts • Optical images help us to decide the type of the sources (point/extended) • The SED over wide range of l is important to explore the nature of sources. Maidanak User's Meeting 2
NIR vs Optical CFHT field Maidanak field Sources located inside red boundary Sources in blue boundary N2 : 31,000 27,181 (87%) N2 : 62,000 50,431 (81%) N3 : 36,000 30,111 (81.7%) N3 : 74,000 51,954 (70.3%) N4 : 34,000 26,329 (77.4%) N4 : 68,000 45,604 (67%) Number of matched sources to CFHT catalogue Number of matched sources to Maid. catalogue optical observation for each field Maidanak User's Meeting 2
MIR vs Optical CFHT field Maidanak field Sources located inside red boundary Sources in blue boundary S7 : 5,209 4,639 ( 89.1%) S7 :11,500 10,280 ( 89.4%) S9W : 6,400 5,616 ( 87.8%) S9W : 13,420 12,187 (90%) S11 : 5,285 S11 : 11,260 4,551 ( 86.1%) 9,736 (86.4 %) L15 : 4,385 3,183 (72.6%) L15 : 9,530 6,014 ( 63.1%) L18W: 3,414 3,414 (68.6%) L18W : 11,094 6,388 (57.6%) Number of matched sources to CFHT catalogue Number of matched sources to Maid. catalogue optical observation for each field Maidanak User's Meeting 2
Final Catalogue • Final catalogues should contain reliable astronomical sources • We used ground based J & H data from KPNO (Jeon et al.), and other AKARI band data for further confirmation of the sources Maidanak User's Meeting 2
NIR bands positional cross-matching 1,534 (1.7%) 3,375 (3.2%) 6,384 (6.5%) o p t i c a l d a t a ( CFHT + Maidanak ) other data used for matching test K P N O J , H d a t a N3 , N4 N2 , N4 N2 , N3 S7 # of sources not matched even once
MIR-S bands positional cross-matching 362 (2.35%) 408 (2.17%) 640 (4.08%) N2 N2 N2 N3 N3 N3 N4 other bands used for matching test N4 N4 S7 S7 S9W S11 S9W S11 L15 L15 L15 L18W L18W L18W # of sources not matched even once
Summary • Maidanak optical imaging data provided useful tool for the confirmation of NEP-Wide IR sources. • NEP-Wide NIR/MIR catalogue is almost ready (~100,000 sources/5.8 sq. deg.) • Maidanak and CFHT used different filters, and less sensitivity than CFHT • Maidanak observation was carried out before cleaning of the mirror: • Carry out new survey with SDSS filter set? • It will take large amount of observing time. Maidanak User's Meeting 2