Download
1 / 24
240 likes | 411 Views
Time is Money – Business Interruption & the Supply Chain. Dr Grant Foster Aon Global Risk Consulting. Resilience. Define: resilience : the physical property of a material that can return to its original shape or position after deformation that does not exceed its elastic limit .

E N D
Time is Money – Business Interruption & the Supply Chain Dr Grant Foster Aon Global Risk Consulting
Resilience Define: resilience: the physical property of a material that can return to its original shape or position after deformation that does not exceed its elastic limit Business Unit/Tier 2 (Mandatory)| Market/Division/Tier 3 (Optional) | Practice Group/Tier 4 (Optional)Proprietary & Confidential (Optional) | Date (Optional)
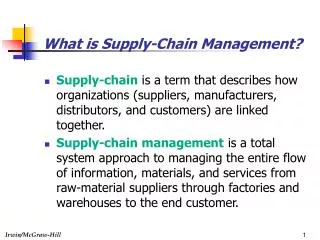
Supply Chain Drivers • Driver: cost: • Increase efficiency • Remove duplication • Outsourcing (concentrate on key skills, speed to market, risk sharing) • Single Sourcing (better contractual terms) • Minimise stock levels FAT Driver (Balance): time, quality LEAN Business Unit/Tier 2 (Mandatory)| Market/Division/Tier 3 (Optional) | Practice Group/Tier 4 (Optional)Proprietary & Confidential (Optional) | Date (Optional)
Three Steps To Improving Supply Chain Resilience • Create a model • (Know when the elastic band will break) 2. Quantify ‘What Ifs’ 3. Respond Appropriately (Stop the band breaking – or have something else in place) Business Unit/Tier 2 (Mandatory)| Market/Division/Tier 3 (Optional) | Practice Group/Tier 4 (Optional)Proprietary & Confidential (Optional) | Date (Optional)
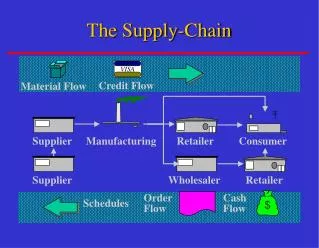
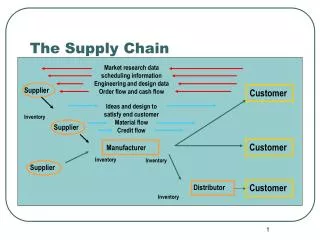
Bill Of Materials What is in the model? Production capacity Inventory at various stages Manufacturing Packaging Manufacturing Packaging Raw Materials Manufacturing Packaging Distribution This all relates (eventually) to time Business Unit/Tier 2 (Mandatory)| Market/Division/Tier 3 (Optional) | Practice Group/Tier 4 (Optional)Proprietary & Confidential (Optional) | Date (Optional)
Bill Of Materials What does a link in the chain look like? Operating modes Manufacturing Flow rate Storage Capacity Call off rate Business Unit/Tier 2 (Mandatory)| Market/Division/Tier 3 (Optional) | Practice Group/Tier 4 (Optional)Proprietary & Confidential (Optional) | Date (Optional)
So what do we calculate? Production capacity Inventory at various stages Raw Materials Manufacturing Packaging Distribution Consider the loss of production from a particular Manufacturing site. Several types of risk event may lead to this outcome. Some insurable (e.g. fire, flood etc) some non insurable (Strike, Government restrictions etc). Reduction of production capacity (e.g. if it is the only site -> 0%, if there are multiple sites we assume the others can go to maximum capacity which may make up some of the capacity shortfall) Recovery time for the site The supply chain can still operate for a certain length of time depending on the inventory in the downstream chain The following components give us a critical buffer time (i.e. how long we can keep going before BI really starts): the stock buffer time (from 3), the production achieved in this buffer time (from 1) Business Interruption occurs if recovery time (from 2) is larger than the Critical Outage Time (from 4) Business Unit/Tier 2 (Mandatory)| Market/Division/Tier 3 (Optional) | Practice Group/Tier 4 (Optional)Proprietary & Confidential (Optional) | Date (Optional)
Bill Of Materials So what do we calculate? Production capacity Inventory at various stages Raw Materials Manufacturing Packaging Distribution Consider the loss of production from a particular supplier. There is a certain amount of inventory at the Manufacturing site Recovery time to find an alternative supplier – this may be small if there are other suppliers available The supply chain can still operate for a certain length of time depending on the inventory in the downstream chain The following components give us a possible outage time is : the inventory buffer time (from 1), the recovery time (from 2) Business Interruption occurs if possible outage time (from 4) exceeds the critical buffer time for the Manufacturing site Business Unit/Tier 2 (Mandatory)| Market/Division/Tier 3 (Optional) | Practice Group/Tier 4 (Optional)Proprietary & Confidential (Optional) | Date (Optional)
So what do we calculate? Production capacity Inventory at various stages Raw Materials Manufacturing Packaging Distribution Consider the loss of a Distribution Centre site. Reduction of production capacity – may be zero if at the end of the chain and if we can meet demand by directly shipping from production Recovery time for the site The supply chain can still operate at full production capacity The following components give us a critical buffer time (i.e. how long we can keep going before BI really starts): the time to put in place alternative logistics arrangements Business Interruption occurs if recovery time (from 2) is larger than the Critical Outage Time (from 4) Business Unit/Tier 2 (Mandatory)| Market/Division/Tier 3 (Optional) | Practice Group/Tier 4 (Optional)Proprietary & Confidential (Optional) | Date (Optional)
2. Quantify The ‘What If’s’ Manufacturing Suppliers BI graph Packaging Suppliers BI graph Overall Supply Chain BI graph What if? Each part of supply chain fails? Trends exceed certain thresholds? Different levels of inventory are held? Structure of the Supply Chain is changed? Business Unit/Tier 2 (Mandatory)| Market/Division/Tier 3 (Optional) | Practice Group/Tier 4 (Optional)Proprietary & Confidential (Optional) | Date (Optional)
Production Optimisation • A production model has been developed for white goods manufacture across the four European sites. • Notable features include: • A production optimiser that gives the minimum cost production distribution based on manufacture and transportation costs • Optimiser works between minimum and maximum levels of production at sites • Variable costs due to increased shift work • Business interruption exposures based upon a demand profile across a year • Consideration of stock levels on actual BI numbers The Excel model estimates the following: Production cost delta – i.e. difference in cost of production given a BI event Additional transport costs – arising from supplying from stock Shortfall production costs – production costs to bring stock up to pre BI event level Loss profit costs – loss of profit when demand cannot be met Business Unit/Tier 2 (Mandatory)| Market/Division/Tier 3 (Optional) | Practice Group/Tier 4 (Optional)Proprietary & Confidential (Optional) | Date (Optional)
3. Respond Appropriately Retained risk: Transferred risk: Insurance for Loss of profit, lost market share, AICOW etc Business Unit/Tier 2 (Mandatory)| Market/Division/Tier 3 (Optional) | Practice Group/Tier 4 (Optional)Proprietary & Confidential (Optional) | Date (Optional)
Response Example – Supplier Support Business Unit/Tier 2 (Mandatory)| Market/Division/Tier 3 (Optional) | Practice Group/Tier 4 (Optional)Proprietary & Confidential (Optional) | Date (Optional)
Summary – Some ideas to increase Supply Chain resilience • Companies may accept different supply chain risks depending on the stage of the production lifecycle • Supply Chain risks are closely related to business interruption and product recall risks. • Resilience depends on having alternatives and creativity. Companies need to make time to nurture this. • A multi discipline approach is required to address supply chain risk. including Procurement, Production, Logistics, Insurance, Loss Control, Legal, Finance, Planning etc. • A simple approach for resilience is based upon the following: • Preparedness • Response • Recovery • Strategy • Create a model to allow you to test scenarios • Test your assumptions on the response to ‘what ifs’ particularly; • Contractual arrangements • Business Continuity Management • What is possible • Know your inventory strategy • Be clear on trends – when are they going to be reviewed? • Know what your organisation is comfortable with Business Unit/Tier 2 (Mandatory)| Market/Division/Tier 3 (Optional) | Practice Group/Tier 4 (Optional)Proprietary & Confidential (Optional) | Date (Optional)
Fin Dr Grant Foster Aon Global Risk Consulting
What are Supply Chain Managers Worried About? Trends • Unfavourable exchange rate movements 39% • Input price increases 34% • Energy price increases 33% • Declining customer confidence 24% • Protectionism 23% • Insolvency of suppliers 21% Negotiated lower prices from suppliers 58% Increased efficiency of logistics 35% Increased use of outsourcing 30% Reduced inventory levels 29% Increased number of suppliers 23% Reduced number of suppliers 20% Moved production to lower-cost countries 19% Reduced headcount in supply chain function 19% Business Unit/Tier 2 (Mandatory)| Market/Division/Tier 3 (Optional) | Practice Group/Tier 4 (Optional)Proprietary & Confidential (Optional) | Date (Optional)
Supply Chain Basics Upstream Downstream Tier n Tier 2 Supplier Tier 1 Supplier ‘Our Company’ Customers Tertiary Supplier Tier 4 Supplier Value Generating Activities Level of control decreases with each tier of supply And is harder to assure and insure Business Unit/Tier 2 (Mandatory)| Market/Division/Tier 3 (Optional) | Practice Group/Tier 4 (Optional)Proprietary & Confidential (Optional) | Date (Optional)
Change Management Case Study #1 – ‘We Messed Up’ Loss Control Contract Risk Pharmaceutical Company Tier 2 Supplier Tier 1 Supplier ‘Our Company’ Customers Background A drug manufacturing facility was taken in house due to regulatory issues Supply chain in place with a ‘make it & take it’ agreement with supplier What Happened? Serious fire at the facility Supply Chain Interruption Forced to take the stock from the supplier, and then dispose of it as it had a limited shelf life Business Unit/Tier 2 (Mandatory)| Market/Division/Tier 3 (Optional) | Practice Group/Tier 4 (Optional)Proprietary & Confidential (Optional) | Date (Optional)
Case Study #2 – ‘Face the music’ Contract Risk BCM Entertainment UK (Woolworths) Tier 2 Supplier Tier 1 Supplier ‘Our Company’ Customers Background EUK was the most profitable arm of Woolworths Group Major supplier of CDs and DVDs to UK market Winner of several awards for supply chain management What Happened? Woolworths Group and hence EUK put into administration in 2008 Zavvi (Virgin Megastores) had an exclusive supply deal. Unable to get favourable terms from other suppliers Zavvi also forced into administration Business Unit/Tier 2 (Mandatory)| Market/Division/Tier 3 (Optional) | Practice Group/Tier 4 (Optional)Proprietary & Confidential (Optional) | Date (Optional)
Case Study – Wessex Foods July 2010 BCM Prioritised Customer? Business Unit/Tier 2 (Mandatory)| Market/Division/Tier 3 (Optional) | Practice Group/Tier 4 (Optional)Proprietary & Confidential (Optional) | Date (Optional)
Case Study #3 – ‘Two becomes one’ Packaging Company Tier 1 Supplier A Inventory Control BCM Tier 2 Supplier ‘Our Company’ Customers Tier 1 Supplier B Background Manufacturer of rubber stoppers for phials Rubber sourced from a Tier 1 supplier What Happened? Tier 2 supplier had a fire Alternative Tier 1 suppliers were in place. Unfortunately they both sourced rubber from the same Tier 2 supplier. Business Unit/Tier 2 (Mandatory)| Market/Division/Tier 3 (Optional) | Practice Group/Tier 4 (Optional)Proprietary & Confidential (Optional) | Date (Optional)
Case Study #4 – Downstream Problem Stock / Inventory Control Contract Risk BCM Chemical Company Tier 2 Supplier Tier 1 Supplier ‘Our Company’ Customers Background Large scale industrial chemical company ‘Fixed supply chain’ in that customers take output directly from a shared pipeline What Happened? Unplanned shutdown of customer site Sufficient output storage available (Site production policy was to run with minimum storage) Arrangements in place with other customers to receive extra output in short term Business Unit/Tier 2 (Mandatory)| Market/Division/Tier 3 (Optional) | Practice Group/Tier 4 (Optional)Proprietary & Confidential (Optional) | Date (Optional)
Supply Chain risk profile across lifecycle Dual sourcing Reduce stock Accept greater BI risk - lean Free-up in-house capability by outsourcing Establish back-up capacity & stock as appropriate Line extensions Range rationalisation Simplification Single sourced? Competition, price Increase range Manage for Profit Consider:- risk in supply chain design capacity provision ahead of demand line as back-up Manage for Cash Uncertainty of forecasts Divestment Manage for Growth Product Withdrawal New product introductions rapid launches Launch Growth Maturity Saturation Decline Business Unit/Tier 2 (Mandatory)| Market/Division/Tier 3 (Optional) | Practice Group/Tier 4 (Optional)Proprietary & Confidential (Optional) | Date (Optional)
How to improve resilience Business Unit/Tier 2 (Mandatory)| Market/Division/Tier 3 (Optional) | Practice Group/Tier 4 (Optional)Proprietary & Confidential (Optional) | Date (Optional)