Download
1 / 19
190 likes | 431 Views
Retrieval of Water Properties from Remote Sensing Reflectance. Presenter: Candy Barbaran – Martin Van Buren High school Mentors: Professor Fred Moshary, Dr. Alex Gilerson Department of Electrical Engineering. Introduction.

E N D
Retrieval of Water Properties from Remote Sensing Reflectance Presenter: Candy Barbaran – Martin Van Buren High school Mentors: Professor Fred Moshary, Dr. Alex Gilerson Department of Electrical Engineering
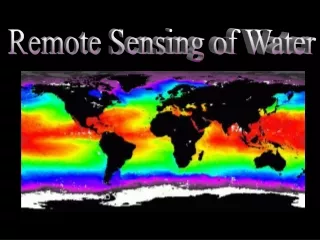
Introduction • Ocean color remote sensing is used to monitor the earths carbon cycle, ocean water quality and contributes to climate research. • Scattering and absorption change the intensity of light as a function of depth, wavelength and direction. • The purpose of detecting all IOPs of the water itself and of all its constituents through remote sensing is to enable the measurement of biochemical parameters more accurately.
Long Term Objective • Improve algorithms for instruments aboard satellites in order to make Fluorescence measurements of algae more accurate.
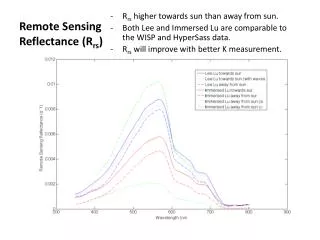
Index of refraction, distribution, Particle Size and Properties of all constituents Inherent Optical Properties (IOPs) The Forward Problem • The forward problem of ocean color remote sensing uses assumed values for IOPs which are used to predict the shape and or distribution of water leaving radiance (Rrs). • The IOPs themselves are based on particle size, index of refraction distribution and shape. Remote Sensing Reflectance
The Forward problem • Measurements taken by instruments aboard satellites need to be compared to measurements taken directly off the field to test for accuracy. • It is difficult to compare measurements satellite data sets vs In situ data sets. • Values are assumed for IOPs which are used to predict the shape and or distribution of water leaving radiance (Rrs). Hydrolight is used to simulate data sets with biochemical parameters that vary in concentration and diverseness which can be found in the field . Curtis D. Mobely Ludia K. Sundman Sequia Scientific , Inc
MODIS aboard Aqua • Hardware aboard Aqua can be used to study climate change, vegetation, water vapor in the atmosphere, clouds and more. • Aqua has nearly a polar route and makes measurements at the same time everyday. Moderate Resolution Imaging Spectrometer takes 2 days to cover the globe. Has 36 different spectral bands and acquires 2,330 km swaths.
The Inverse Problem • When working in the inverse want to obtain Inherent Optical Properties using the upwelling radiance spectrum. • This is difficult because we only know the water leaving radiance for only a few bands. • SeaDAS outputs the biogeochemical parameters and also allows to account for various flags such as glint,cloud coverage and other variables that obstruct the pure signal to be detected by the satellites. IOCCG Report Number 5 (2006):Remote Sensing of Inherent Optical Properties: Fundamentals, Tests of Algorithms, and Applications.
Procedure • Satellite imagery was retrieved through the use of SeaDAS for the areas of Chesapeake bay and Long Island Sound which are some locations from which we retrieve in situ data sets. • Hydrolight was used to simulate Coastal water conditions. • Several runs were made using Hydrolight using different absorption coefficients and concentration levels for each component. (Chlorophyll, CDOM , Mineral and water) • Data Retrieved from Hydrolight was than graphed and analyzed to determine the effects of concentration of the various components for coastal waters. • Further work would be to validate the accuracy of our algorithms when used in complex waters using simulated data sets.
SeaDAS Processed Images Chesapeake Bay Long Island Sound
In Situ spectrum for Remote sensing Reflectance Vs MODIS Bands Wavelength (nm) Wavelength (nm)
4 Chl (mg/m^3) 3.85 5.26 3 6.68 7.72 9.18 13.67 Absorption m ^-1 2 21.98 35.41 52.4 77.43 1 89.17 95.17 0 0 350 400 500 600 700 800 850 Wavelength (nm) Absorption of Chlorophyllous particles and CDOM spectra used for the simulation of Reflectance's by Hydrolight Absorption 5 coefficients .39 4 .64 1.43 2.1 3 Absorption (m ^-1) 2.54 2.62 2.95 3.31 2 4.12 4.21 4.37 1 4.79 0 400 500 600 700 800 Wavelength (nm) Absorption of Chlorophyllous particles used for the simulation of Reflectance's by Hydrolight ,
Absorption of CDOM used for the simulation of Reflectance's by Hydrolight Absorption 5 coefficients mg/m^3 .39 4 .64 1.43 2.1 Absorption (m ^-1) 3 2.54 2.62 2.95 3.31 2 4.12 4.21 4.37 1 4.79 0 400 500 600 700 800 Wavelength (nm)
Total absorption Water absorption Absorption of water and Total Absorption spectra used for the simulation of reflectance's by Hydrolight
Backscattering spectra of chlorophyllous particles and mineral particles used in the simulation of Reflectances by Hydrolight Chl backscattering Mineral backscattering
Backscattering spectra of water and total backscattering used in the simulation of Reflectances by Hydrolight ,
Maximum backscatter peaks (chl) or minimum absorption Maximum backscatter peaks (chl) or minimum absorption Strong CDOM absorption slope Strong CDOM absorption slope Maximum absorption peaks (chl) Maximum absorption peaks (chl) Retrieved from Hydrolight Typical reflectance spectra Rrs= bb/ (a + bb) ≈ Lu/Ed Retrieved from Hydrolight Typical reflectance spectra Rrs= bb/ (a + bb) ≈ Lu/Ed
Conclusions • Each component has a signature absorption and backscattering spectrum • The steep slope of CDOM absorption has an inverse relationship with the magnitude of reflectance in the blue area of the spectrum(400-500). • Maximum absorption peaks from 650-700 nm cause minimal reflectance in that part of the spectrum. • There's a red shift for cases of high chlorophyll concentration. • All of these observations need to be taken into account when working in the inverse ; in other words when using remote sensing reflectance to retrieve Inherent Optical Properties (IOPs).
Resources • IOCCG Report Number 5 (2006): Remote Sensing of Inherent Optical Properties: Fundamentals, Tests of Algorithms, and Applications. • Curtis D. Mobley 1994 Academic press California Light and water (Radiative Transfer in Natural Waters) • Vera De Cauwer, Polytechnic of Namibia MANUAL FOR WORKING WITH MODIS IMAGES IN SEADAS 4.9.4 – Draft version 1 • Curtis D. Mobley , Lydia K Sundman, Sequia Scientific, Inc • Hydrolight Users Guide • http://marine.rutgers.edu/cool/sat_data/?product=sst®ion=chess¬humbs=0 • http://www.wetlabs.com/iopdescript/iopintro.htm
Dr. Alex Gilerson Professor Fred Moshary Dr. Jing Zhou