Download
1 / 11
110 likes | 267 Views
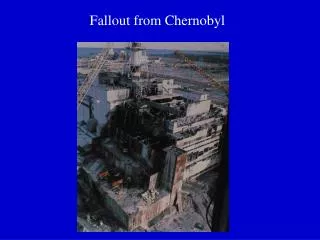
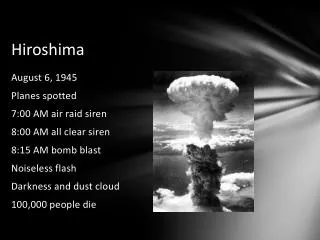
Fallout Deposition In Hiroshima Where Gamma-Ray Thermoluminescence Measurements Exceed the Dosimetry System (DS02) Doses. Stephen D. Egbert Science Applications International Corporation Presentation at Health Physics Meeting – Sacramento, Calif. - July 24, 2012

E N D
Fallout Deposition In Hiroshima WhereGamma-RayThermoluminescence Measurements Exceed the Dosimetry System (DS02) Doses Stephen D. EgbertScience Applications International Corporation Presentation at Health Physics Meeting – Sacramento, Calif. - July 24, 2012 Department of Energy Special Session on Atomic Bomb Survivor Dosimetry – Residual Radiation Exposure
Residual Radiation at Hiroshima • Since 1945, we believed Hiroshima residual radiation • Hypocenter neutron ground activation (out to 0.5 km) • Koi-Takasu area fission products (WSW 3-4 km) • Possibly in “black rain” area fission products (NW 1-10 km) • Shizuma (1996) finds a pattern of 137Cs, but very little • Imanaka (2011) finds original MED survey readings • Pattern like 137Cs; But higher dose especially NNE at ~2 km • Slow drop off in south until ~1 km where measurements end • Egbert and Kerr (2012) finds four high TLD dose areas • Nishitera temples (NNW 1 km) ~500-900 mGy • Hiroshima University area (south 1.5 km) ~200 mGy • Miyosen Temple (east 1.9 km) ~100 mGy • Hiramoto House (west 2.1 km) ~100 mGy • TLD pattern is similar to survey and 137Cs, but one and two orders-of-magnitude higher, respectively MED – Manhattan Engineering District TLD – Thermoluminescence Dosimetry
DS02 γ Dose Summary • Measured γ doses were obtained in ceramic tiles by thermoluminescence dosimetry (TLD) and compared with discrete ordinate and Monte Carlo calculations • In DS02 Report Executive Summary for γ dose • For Hiroshima “there remain some indications of measured values exceeding calculated values at longer distances” • For Nagasaki “the measured values tend to be somewhat less than calculated values, at least out to about 800 meters from the hypocenter” • Average weighted γ dose M/C ratio was 1.06 at Hiroshima and 0.80 at Nagasaki DS02 – Dosimetry System 2002 M/C – Measurement to Calculation
Click for animation Hiroshima TLD Measurements to Calculation Ratio Nagasaki TLD Measurements to Calculation Ratio (After adjustment for unaccounted shielding) TLD – Thermoluminescence Dosimetry
Excess TLD Doses in 20 Nagasaki Neighborhoods Used in the DS02 Report TLD – Thermoluminescence Dosimetry DS02 – Dosimetry System 2002
Excess TLD Doses in 29 Hiroshima Neighborhoods Used in the DS02 Report TLD – Thermoluminescence Dosimetry DS02 – Dosimetry System 2002
0.01 0.02 0.03 0.1 0.03 MED Survey Map Over Hiroshima Excess TLD Measurements • Survey contours from measurements made during October 3-7, 1945 • (in milliroentgen per hour) • TLD locations identified • Excess TLD dose locations labeled in italic red (>0.04 Gy) and underlined (>0.4 Gy) or blue (not observed) • Shading indicates confidence • TLD samples, with small black labels, are too close to hypocenter MED – Manhattan Engineering District TLD – Thermoluminescence Dosimetry
Map of 137Cs and Rain Amount Over Hiroshima Excess TLD Measurements • Shizuma 137Cs measurements indicated by relative radius of circles. Red circle is scaled down by a factor of 20 in order to fit on page (~0.04 Gy) • TLD locations identified • Excess TLD dose locations labeled in italic red (>0.04 Gy) and underlined (>0.4 Gy) or blue (not observed) • Shading indicates confidence • TLD samples, too close to hypocenter, are not shown TLD – Thermoluminescence Dosimetry
0.1 0.2 0.5 0.8 Nishiyama Reservoir 0.9 1.0 0.03 0.02 0.005 MED Survey Map Over Nagasaki TLD Measurements • Survey contours from measurements made during September 21 to October 4, 1945 • (in milliroentgen per hour) • TLD locations identified • Excess TLD dose locations labeled in italic red (>0.04 Gy) and underlined (>0.4 Gy) or blue (not observed) • Shading indicates confidence • TLD samples, with small black labels, are too close to hypocenter MED – Manhattan Engineering District TLD – Thermoluminescence Dosimetry
Discussion About Excess TLD Dose Method • Advantages of Excess TLD Dose Method • Excess TLD dose and residual dose to survivors may be from same isotope(s), absorbed in same period (first days) • Location TLD dose received is stationary and known • Few TLD weathering effects - No rain following weeks • TLD may allow proxy measurements of both skin and deep dose using ceramic as surrogate • Disadvantages • Cannot discern excess TLD dose closer than 1 km from hypocenter, where initial radiation gamma-ray dose is high • Uncertainty of ceramic TLD background may cause significant uncertainty in estimate of excess TLD dose TLD – Thermoluminescence Dosimetry
Conclusions • TLD measurements and DS02 calculations are consistent, except in certain Hiroshima neighborhoods beyond 1 km • TLD measurements in excess of DS02 calculations may be from fallout deposited on or near a measured ceramic sample • It may be possible to make TLD measurements using different layers of the same sample to obtain data on the β, γ and bremsstrahlung doses from fallout • Obtaining a more complete set of TLD measurements (beyond 1 km) is a method to distinguish which suburbs and neighborhoods did and did not receive fallout • It may be possible to use excess TLD dose to estimate fallout deposition to provide a basis for calculating fallout doses to distal as well as proximal Japanese survivors • Other physical dosimetry and biological effects for survivors, such as epilation, should be reexamined to see if similar patterns are observed as indicated by the excess TLD doses TLD – Thermoluminescence Dosimetry DS02 – Dosimetry System 2002