Download
1 / 1
10 likes | 60 Views
100%. 100%. 100%. 100%. 100%. 100%. 100%. 100%. 80%. 80%. 80%. 80%. 80%. 80%. 80%. 80%. 60%. 60%. 60%. 60%. 60%. 60%. 60%. 60%. 40%. 40%. 40%. 40%. 40%. 40%. 40%. 40%. 20%. 20%. 20%. 20%. 20%. 20%. 20%. 20%. 0%. 0%. 0%. 0%. 0%. 0%. 0%. 0%. 40 . 40 .

E N D
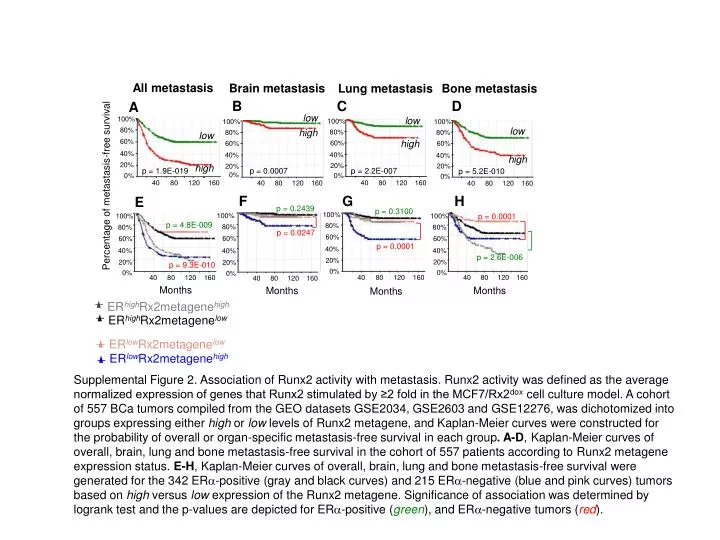
100% 100% 100% 100% 100% 100% 100% 100% 80% 80% 80% 80% 80% 80% 80% 80% 60% 60% 60% 60% 60% 60% 60% 60% 40% 40% 40% 40% 40% 40% 40% 40% 20% 20% 20% 20% 20% 20% 20% 20% 0% 0% 0% 0% 0% 0% 0% 0% 40 40 40 40 80 80 80 80 120 120 120 120 160 160 160 160 40 80 120 160 F G H E All metastasis Brain metastasis Bone metastasis Lung metastasis B C D A low low low high low high high high p = 0.0007 p = 1.9E-019 p = 5.2E-010 Percentage of metastasis-free survival 40 80 120 160 p = 2.2E-007 40 40 80 80 120 120 160 160 p = 0.2439 p = 0.3100 p = 0.0001 p = 4.8E-009 Months Months Months Months p = 0.0247 p = 0.0001 p = 2.6E-006 p = 9.3E-010 ERlowRx2metagenelow ERlowRx2metagenehigh ERhighRx2metagenehigh ERhighRx2metagenelow Supplemental Figure 2. Association of Runx2 activity with metastasis. Runx2 activity was defined as the average normalized expression of genes that Runx2 stimulated by ≥2 fold in the MCF7/Rx2dox cell culture model. A cohort of 557 BCa tumors compiled from the GEO datasets GSE2034, GSE2603 and GSE12276, was dichotomized into groups expressing either high or low levels of Runx2 metagene, and Kaplan-Meier curves were constructed for the probability of overall or organ-specific metastasis-free survival in each group. A-D, Kaplan-Meier curves of overall, brain, lung and bone metastasis-free survival in the cohort of 557 patients according to Runx2 metagene expression status. E-H, Kaplan-Meier curves of overall, brain, lung and bone metastasis-free survival were generated for the 342 ER-positive (gray and black curves) and 215 ER-negative (blue and pink curves) tumors based on high versus low expression of the Runx2 metagene. Significance of association was determined by logrank test and the p-values are depicted for ER-positive (green), and ER-negative tumors (red).