Download
1 / 1
10 likes | 162 Views
1 2 3 4 5 . kDa. 85-. 70-. 60-. 50-. 40-. 30-. 25-. 20-. 15-. Additional file 1: Figure S1. SDS-PAGE analysis of overproduced and purified B. cereus Fnr .

E N D
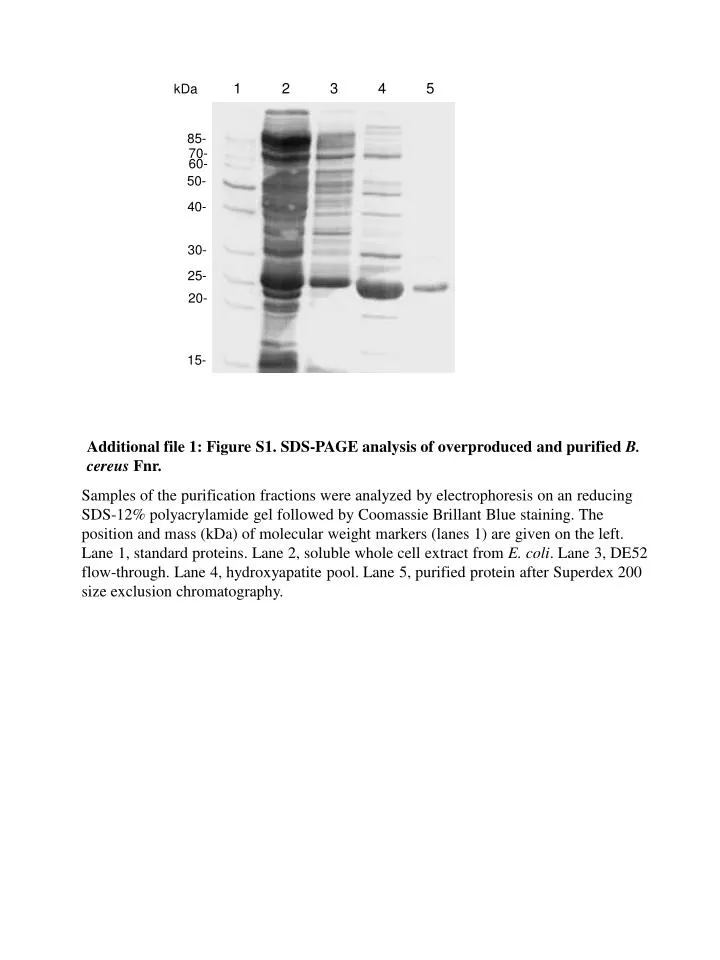
1 2 3 4 5 kDa 85- 70- 60- 50- 40- 30- 25- 20- 15- Additional file 1: Figure S1.SDS-PAGE analysis of overproduced and purified B. cereusFnr. Samples of the purification fractions were analyzed by electrophoresis on an reducing SDS-12% polyacrylamide gel followed by CoomassieBrillant Blue staining. The position and mass (kDa) of molecular weight markers (lanes 1) are given on the left. Lane 1, standardproteins. Lane 2, soluble whole cell extract from E. coli. Lane 3, DE52 flow-through. Lane 4, hydroxyapatite pool. Lane 5, purified protein after Superdex 200 size exclusion chromatography.