Download
1 / 24
240 likes | 311 Views
ATM S 111, Global Warming: Understanding the Forecast. Dargan M. W. Frierson Department of Atmospheric Sciences Day 4: 04/08/2010. Reading Assignment. Should have read “Who’s Responsible” p.32-42 Next assignment: read “Extreme Heat” p.45-57. Today: Who’s Responsible?.

E N D
ATM S 111, Global Warming: Understanding the Forecast Dargan M. W. Frierson Department of Atmospheric Sciences Day 4: 04/08/2010
Reading Assignment Should have read “Who’s Responsible” p.32-42 Next assignment: read “Extreme Heat” p.45-57
Today: Who’s Responsible? • How much are average emissions for: • Citizen of the world • Average American • Nations of the world • Which sectors do emissions come from? • Transportation • Electricity generation • Industry • “Carbon efficiency”
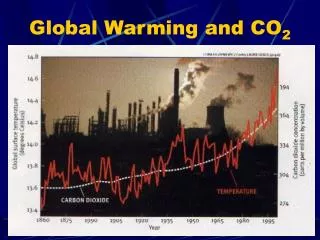
Carbon Dioxide vs Other Pollutants • Most pollution is felt near the source • Air quality near urban centers or coal power plants • Water quality near mining, etc • CO2 is not like this! • Since CO2 stays in the atmosphere for so long, everyone’s emissions affect everyone else • Truly a global problem • So it makes sense to think about who’s responsible
How Much Carbon Dioxide Is There? • Total amount of carbon dioxide in the atmosphere: 3000 gigatonnes • World emissions: over 30 gigatonnes per year • 1 gigatonne = 1 billion metric tons • And one metric ton is a little more than a regular ton (2000 pounds)
Gigatonnes… • Confession: I hate dealing with really big numbers like this • I think they’re hard to put into our everyday experience • Say a company advertises they cut emissions by 500 pounds of CO2 per day: is this a lot or a little?? • It’s important to know the numbers too, but let’s first talk about an easier way to visualize emissions
The “Carbon Blanket” • What if all the CO2 in the atmosphere sank to the surface of the Earth and was in one layer of gas • Forming a carbon blanket all over the globe • It would be 3.2 meters (10.5 feet) thick • Preindustrial (1750) thickness was 2.3 m (7.5 feet) • 1990 thickness was 2.9 m (9.5 feet)
Adding to the Carbon Blanket • Each year we emit the equivalent of 3.2 cm (1.26 inches) to the blanket • A little over a foot per decade…
What Happens to CO2 Emissions? • Not all of those emissions go into the atmosphere though • A little less than 50% does actually… • 25% goes into the ocean • Unfortunately this leads to ocean acidification (a future topic) • 30% goes into land ecosystems • So around 6 inches per decade is added into the blanket…
Pieces of the Blanket: China • We can divide up the quilt into sections based on who’s doing the emitting… • Note: my numbers are from 2006 (CDIAC), while the book uses 2004 data China: 20.2% 6.1 gigatonnes per year Source of images: carbonquilt.org
Pieces of the Blanket: USA • We can divide up the quilt into sections based on who’s doing the emitting… • Note: my numbers are from 2006 (CDIAC), while the book uses 2004 data USA: 19.2% 5.8 gigatonnes per year Source of images: carbonquilt.org
Pieces of the Blanket: Canada • We can divide up the quilt into sections based on who’s doing the emitting… • Note: my numbers are from 2006 (CDIAC), while the book uses 2004 data Canada: 1.6% 0.5 gigatonnes per year Source of images: carbonquilt.org
Pieces of the Blanket: Bangladesh • We can divide up the quilt into sections based on who’s doing the emitting… • Note: my numbers are from 2006 (CDIAC), while the book uses 2004 data Bangladesh: 0.1% 41 million tonnes per year Source of images: carbonquilt.org
Pieces of the Blanket: Somalia • We can divide up the quilt into sections based on who’s doing the emitting… • Note: my numbers are from 2006 (CDIAC), while the book uses 2004 data Somalia: 0.0004% 172 thousand tonnes per year Source of images: carbonquilt.org
National Emissions • Another way to look at national carbon dioxide emissions • Area of each country is made proportional to its emissions Source of images: WorldMapper
Per capita emissions • Note: The book has a typo in the figure on page 41 (columns 2 and 3) • Should be mass of carbon instead of mass of carbon dioxide • Multiply by 3.67 to get the right numbers for mass of carbon dioxide
Our Individual Share: USA • Per capita matters • Some of these countries are so large because they have large populations USA per capita emissions: 19 tonnes per year Over 100 pounds per day
Individual Share: World Average • Per capita matters though • Some of these countries are so large because they have large populations World per capita emissions: 4.6 tonnes per year Over 25 pounds per day
Our Individual Share: Somalia • Per capita matters though • Some of these countries are so large because they have large populations Somalia per capita emissions: 37 kg per year Less than 100 pounds per year
What Makes Up the Emissions? Burning one gallon of gas = 8.7 kg of CO2 Coal and oil makes up 80% of worldwide emissions Oil for transportation Coal for electricity oil
What Makes Up the Emissions? • Primary sources: • Industry: 40% • Transportation: 22% • Buildings: 30% • Agriculture: 4%
US Emissions Sources Electricity: 42% Transportation: 32% Industry: 15% Residential: 6% Commercial: 4% 2008 data, EPA
US Emissions Sources If you distribute electricity use into the other sectors: Transportation: 32% Industry: 27% Residential: 21% Commercial: 19% 2008 data, EPA
Trends in Energy Use • Industry is getting more efficient • Residential is getting worse • Partially due to significantly larger home sizes • Transportation is getting worse • More cars on the roads, longer driving distances