Download
1 / 20
200 likes | 376 Views
Outlook for Ocean Remote Sensing (Global Component). October 4, 2005. Dr. Eric Lindstrom Physical Oceanography Program NASA Headquarters Earth Science Division, Science Mission Directorate. GCOS Essential Climate Variables

E N D
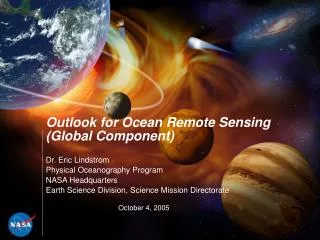
Outlook for Ocean Remote Sensing (Global Component) October 4, 2005 Dr. Eric Lindstrom Physical Oceanography Program NASA Headquarters Earth Science Division, Science Mission Directorate
GCOS Essential Climate Variables Essential Climate Variables that are both currently feasible for global implementation and have a high impact on UNFCCC requirements. Domain Atmospheric(over land, sea and ice) Surface: Air temperature, Precipitation, Air pressure, Surface radiation budget, Wind speed and direction, Water vapour. Upper-air: Earth radiation budget (including solar irradiance), Upper-air temperature (including MSU radiances), Wind speed and direction, Water vapour, Cloud properties. Composition: Carbon dioxide, Methane, Ozone, Other long-lived greenhouse gases , Aerosol properties. Oceanic Surface: Sea-surface temperature, Sea-surface salinity, Sea level, Sea state, Sea ice, Current, Ocean colour (for biological activity), Carbon dioxide partial pressure. Sub-surface: Temperature, Salinity, Current, Nutrients, Carbon, Ocean tracers, Phytoplankton. Terrestrial River discharge, Water use, Ground water, Lake levels, Snow cover, Glaciers and ice caps, Permafrost and seasonally-frozen ground, Albedo, Land cover (including vegetation type), Fraction of absorbed photosynthetically active radiation (fAPAR), Leaf area index (LAI), Biomass, Fire disturbance.
CEOS is constructing a response to the GCOS SatelliteRequirements for UNFCCC (in process Sept 2006 - POC is Barbara Ryan USGS). Satellite Observation of the Climate System The Committee on Earth Observation Satellites (CEOS) Response to the Global Climate Observing System (GCOS) Implementation Plan (IP) Developed by CEOS and submitted to the United Nations Framework Convention on Climate Change (UNFCCC) Subsidiary Body on Scientific and Technical Advice (SBSTA) on behalf of CEOS by the United States of America (USA) delegation Draft - September 2006
“KNOWN” FUTURE ALTIMETRY MISSIONS In orbit End of life Approved Planned/Pending approval GFO NPOESS IPY Data gap ERS-2/RA Sentinel-3 ERS-1 ENVISAT/RA-2 ALTIKA TOPEX/Poseidon Data gap? Data gap? Jason-3? Jason-1 Jason-2 CNES/EUMETSAT/NASA/NOAA signedLetter of Agreement for Jason-2 CRYOSAT-2 GODAE
Summary Assessment • No Bar Nothing • Red Something, Below Threshold • Yellow At threshold (marginal) • Green Above threshold (fully adequate) • Threshold = GCOS ECV threshold • Mission nominal lifetime • Beyond lifetime = go to Red within six months Summary (using a color bar chart….)
Example - ECV Sea Level Planned or pending approval In orbit Approved T/P High accuracy Reference orbit Jason Jason-1 Jason-2 ERS-1 ERS-2 Lower accuracy Polar orbit S-3 Envisat GFO Altika NPOESS ECV Sea Level Above threshold Below threshold At threshold
Challenges for the IOOS Workshop Validate and “regionalize” the established general requirements for coastal remote sensing (Paul Digiacomo to set the stage). 2) Suggest priorities for new/modified remote sensing products to better serve regional applications. 3) Provide ideas for next generation remote sensing capabilities.
BACKUP SLIDES ERIC LINDSTROM
NASA Earth Observatories Ocean & Coastal Research
Several Decades of Satellite Data Records • Sea Surface Temperature • Sea Surface Topography • Sea Surface Winds • Chlorophyll • Precipitation • Sea ice • Geoid
Global Mean Sea Level Trends Sea level trend changes in the past decade have complex global patterns that show basin-wide changes of ocean circulation on decadal time scales L-L Fu, JPL
Global Mean Sea Level Trends For the first time in history the global mean sea level is directly estimated from global observations. The contribution of ice melting is estimated when global mean sea level is coupled with ocean temperature. J. Willis/JPL
2004 ) Ocean Heat Storage - Interannual variability 2 Wm-2 in both data sets: forcing is 0.6 Wm-2/decade - Changes must occur in cloud radiative forcing - New question: how does time varying cloud radiative forcing relate to equilibrium state feedback given varying ocean warming rates?
Sea Surface Salinity: Aquarius The effect of salinity on surface height is comparable to the effect of temperature. Salinity is a key density variable that drives circulation. It is a critical area of scientific uncertainty in the oceans' capacity to store and transport heat that affects the Earth's water cycle and climate. Conventional in situ sampling is sparse. Aquarius will provide the first-ever global maps of salt concentration on the ocean surface. Aquarius will measure global SSS synoptically every month for 3 years, that will link the water cycle, climate, and ocean. Aquarius is joint US-Argentine collaboration - mission confirmation review is scheduled for Fall, 2005 Percentage of dynamic height variability due to salinity (Maes and Behringer, 2000).
Enhancing Ocean Altimetry: Wide Swath • Wide Swath Ocean Altimentry (WSOA) will measure ocean surface topography with a spatial resolution that is required to sample ocean eddies, an important component of the ocean circulation. • WSOA (solid box plus dashed box) will resolve eddies in most of the oceans. It takes more than 5 nadir altimeters to match the WSOA resolution. 1000 yr climate change 100 yr Future Satellites 10 yr 1 yr Time Scale 1 mon Current Satellites 1 wk WSOA 1 d 10-2 10-1 1 10 102 103 104 Spatial Scale (km)
Research and Operations • Process is an evolution • Maturity of transition is parameter dependent • Objective: “… extend relevant NASA research to help NOAA meet short and long-term service and operational mission requirements” • NASA and NOAA have “R2O” working group to address transition Ocean Parameter • Sea Surface Temperature AVHRR MODIS NPP VIIRS NPOESS VIIRS • Sea Surface Height TOPEX/Poseidon Jason OSTM … • Chlorophyll-a SeaWiFS MODIS NPP VIIRS NPOESS VIRS • Ocean Surface Wind QuikSCAT, WindSat/Coriolis NPOESS CMIS • Sea Ice Properties (Extent, Thickness) Extent: DMSP AMSR-E CMIS; Thickness: ICESat • Gravity GRACE • Sea Surface Salinity Aquarius (mission confirmation, Fall 2005)