Download
1 / 4
40 likes | 217 Views
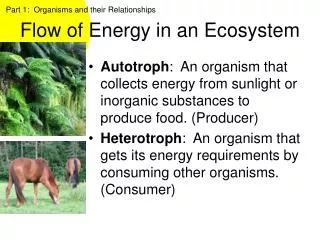
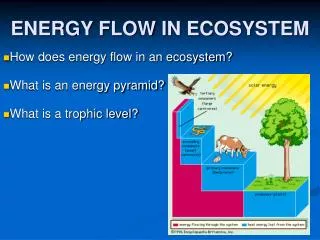
3210.3.1- Interpret a diagram that illustrates energy flow in an ecosystem. Only about 10% of energy is transferred to the next trophic level Available energy decreases because it is released as heat into the environment. Energy Pyramid. Tertiary consumer 0.1%. Secondary consumer 1%.

E N D
3210.3.1- Interpret a diagram that illustrates energy flow in an ecosystem
Only about 10% of energy is transferred to the next trophic level Available energy decreases because it is released as heat into the environment Energy Pyramid Tertiary consumer 0.1% Secondary consumer 1% Primary consumer—10% Primary producer—100% of energy
The closer to the producer in the food chain, the more energy the consumer receives. • The sun provides energy directly to the producers and indirectly to the consumers • Energy flows directly from one level in a food chain to the next. • An organism in a food web can receive energy from multiple levels