Download
1 / 21
210 likes | 297 Views
Data Mining Prof. Chris Volinsky. Equity Portfolio Analysis using Data Mining. Rajesh Shekhar. Objective. Use Data Mining techniques to build a portfolio with superior return/risk characteristics using technical indicators Maximize return Minimize risk

E N D
Data Mining Prof. Chris Volinsky Equity Portfolio Analysis using Data Mining Rajesh Shekhar
Objective • Use Data Mining techniques to build a portfolio with superior return/risk characteristics using technical indicators • Maximize return • Minimize risk • Build different momentum based strategies
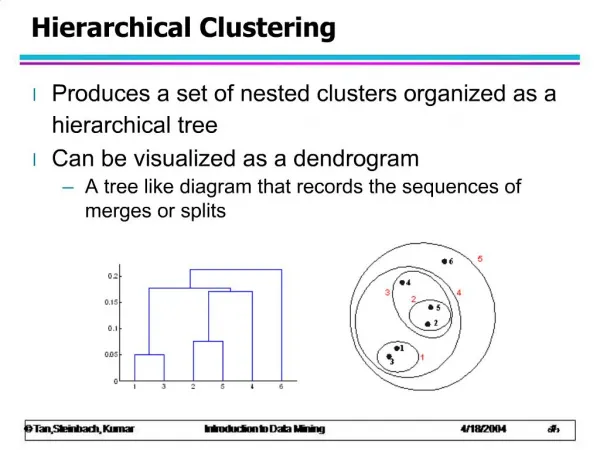
Approach • Risk Diversification • Select stocks across sectors for a natural diversification. • Virtual sectors created using k-means cluster algorithm • Return maximization • Use momentum based indicators to predict future returns • Try different trading algorithms
Data Collection • Investment Universe: Large Market Cap Stocks (Top 100/300/500) • Data collected for everyday stock prices from WRDS (CRSP database) for the entire stock universe from 1999-2009 . • Custom benchmark of top 100/300/500 stocks was created as composition of S&P 500 was not known over the period
Virtual Sectors • Used k-means cluster to create virtual clusters • 11 clusters for 300/500 stock universe and 10 clusters for 100 stock universe • Input: β, Market Cap (Liquidity), P/E (Price/Earning) • βstock = cov(Rstock, Rmarket)/var(Rmarke) • β captures long term adjusted equilibrium rate of return
Stock Selection Model • Different models tried for capturing momentum indicators (linear models (based on APT) • Best model to capture model momentum was: • Based on time decay of historical returns • r = kj*rj where r = predicted stock return j = time period (j=0 for the current time) k = constant achieved after calibration • More weights on recent data • Two years of moving window for prediction • Portfolio analysis and rebalancing every two weeks
Strategies • Long Only • Short Only • Long-Short • Sector Rotation • Sector Portfolio Optimization
Long Only • Basic Idea: Long top “n” performing stocks in each sector based on market cap • Portfolio Weights: All selected stocks are equally weighted in portfolio Short Only • Basic Idea: Short bottom “n” performing stocks in each sector based on market cap • Portfolio Weights: All selected stocks are equally weighted in portfolio
Long / Short • Basic Idea: Combination of Long and Short • Portfolio Weights: All selected stocks are equally weighted in portfolio Sector Rotation Basic Idea: Long top performing sectors & short on bottom performing ones Portfolio Weights: Weight in each sector is proportional to return (More weight on the more outperforming sector; shorting allowed)
Sector Portfolio Optimization • Basic Idea: Select stocks using long only strategy. • Portfolio Weights: Decided by Markowitz Portfolio optimization techniques • Sector Constraints : (weights vary from 1.1 to 0.9 of the target sector weights) • Asset Constraints (Shorting and leverage allowed): (weights vary from -0.1 to 1.1) • Allocation on the efficient frontier
Implementation • MATLAB (Object Oriented) • SQL Server database (> 5 GB of raw data and with indexes 12GB) PortfolioReports &Graphs Portfolio Engine(MATLAB Code) Risk Analysis(MATLAB Code) Performance & Risk Report (SQL Server)Database
Robustness (Testing) • Vary Input parameters • Stock universe (100/300/500) • Stock selected (10/20/40) • Running time window (2001-2002, 2005-2007) • Rebalancing period (15/21/30/45 days)
Performance Attribution • Benchmark : Custom Benchmark • Value-added Return = Pure sector allocation + Allocation/Selection interaction + Within-sector selection RV= + + Rv = the value-added return wP,j= portfolio weight of sector j wB,j= benchmark weight of sector j RP,j= portfolio return of sector j RB,j= benchmark return of sector j RB = return in the portfolio’s benchmark S = number of sectors
Other Issues • Transaction Costs: • Slippage cost and explicit costs are taken into account • Market impact and other implicit costs are ignored • Leverage costs are not taken into account • Portfolio Turnovernot taken into account
Conclusions • Virtual sectors works reasonably well. • Time decay returns is a decent predictor of future returns in stable market for short time periods. • Statistically relevant for large market caps.