Download
1 / 83
850 likes | 1.08k Views
Equity Portfolio Management. 02/02/09. Passive versus Active Management. Passive equity portfolio management Long-term buy-and-hold strategy Usually tracks an index over time Designed to match market performance Manager is judged on how well they track the target index

E N D
Equity Portfolio Management 02/02/09
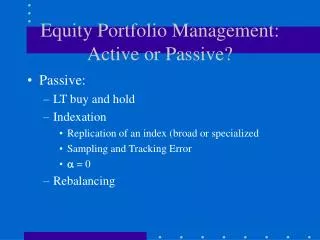
Passive versus Active Management • Passive equity portfolio management • Long-term buy-and-hold strategy • Usually tracks an index over time • Designed to match market performance • Manager is judged on how well they track the target index • Active equity portfolio management • Attempts to outperform a passive benchmark portfolio on a risk-adjusted basis
Passive versus Active Management • One way to distinguish these strategies is to decompose the total actual return the manager attempts to produce: Total return = Expected return + alpha = (Rf + risk premium) + alpha Passive Active
An Overview of Passive Equity Portfolio Management Strategies • Replicate the performance of an index • May slightly underperform the target index due to fees and commissions • Costs of active management (1 to 2 percent) are hard to overcome in risk-adjusted performance
Index Portfolio Construction Techniques • Full replication • Sampling • Completeness Funds
Full Replication • All securities in the index are purchased in proportion to weights in the index • This helps ensure close tracking • Increases transaction costs, particularly with dividend reinvestment
Sampling • Buys a representative sample of stocks in the benchmark index according to their weights in the index • Fewer stocks means lower commissions • Reinvestment of dividends is less difficult • Will not track the index as closely, so there will be some tracking error • Tracking error is the extent to which return fluctuation in the portfolio is not correlated with benchmark return fluctuation.
Expected Tracking Error Between the S&P 500 Index and Portfolio Comprised of Samples of Less Than 500 Stocks Expected Tracking Error (Percent) Exhibit 16.2 4.0 3.0 2.0 1.0 500 400 300 200 100 0 Number of Stocks
Calculating Tracking Error • The annualized tracking error for a portfolio is calculated as: where
Calculating Tracking Error and where Rpt and Rbt are the portfolio and benchmark returns in period t, T is the total number of periods and P is the number of periods per year. • This tracking error represents the standard deviation of the portfolio excess return.
Using Tracking Error to Classify Managers • The tracking error of a manager can be used to classify his investment style: Passive TE < 1% Structured 1% < TE < 3% Active TE > 3%
Completeness Funds • Completeness funds complement active portfolios. • Funds are allocated to sectors and styles that are not represented in the active portfolios
Justification for indexing • Markets are efficient OR • There are superior managers but it is difficult to identify them before the fact OR • The potential for higher returns from active management does not compensate for the higher risk and higher transaction costs
Efficient Capital Markets • In an efficient capital market, security prices adjust rapidly to the arrival of new information. • Whether markets are efficient has been extensively researched and remains controversial.
Why Should Capital MarketsBe Efficient? • The premises of an efficient market • A large number of competing profit-maximizing participants analyze and value securities, each independently of the others • New information regarding securities comes to the market in a random fashion • Profit-maximizing investors adjust security prices rapidly to reflect the effect of new information • Conclusion: In an efficient market, the expected returns implicit in the current price of a security should reflect its risk
Efficient Market Hypotheses (EMH) • Weak-Form EMH - prices reflect all security-market information • Semistrong-form EMH - prices reflect all public information • Strong-form EMH - prices reflect all public and private information
Weak-Form EMH • Current prices reflect all security-market information, including the historical sequence of prices, rates of return, trading volume data, and other market-generated information. • Implication (i.e., if hypothesis holds): Past rates of return and other market data should have no relationship with future rates of return.
Weak-Form EMH • Tests: Runs tests, filter rule tests • Results: Results generally support the weak-form EMH, but results are not unanimous
Semistrong-Form EMH • Current security prices reflect all public information, such as firm and market related announcements, P/E ratios, P/BV ratios, etc. • Implication: Decisions made on new information after it is public should not lead to above-average risk-adjusted profits from those transactions.
Semistrong-Form EMH • Tests: • Can aggregate market information allow us to estimate future returns? • Can firm-specific and market announcements (events) be used to predict future returns? • Are there characteristics of certain securities that will allow you to generate above-average risk-adjusted returns?
Semistrong-Form EMH • Results: • short-horizon returns have limited results • long-horizon returns analysis has been quite successful based on • aggregate dividend yield (D/P) • default spread • term structure spread • Quarterly earnings reports may yield abnormal returns due to unanticipated earnings change
Semistrong-Form EMH • Results: • The January Anomaly • Stocks with negative returns during the prior year had higher returns right after the first of the year • Tax selling toward the end of the year has been mentioned as the reason for this phenomenon • Such a seasonal pattern is inconsistent with the EMH
Semistrong-Form EMH • Results: • Event studies • Stock split studies show that splits do not result in abnormal gains after the split announcement, but before. • Initial public offerings seems to be underpriced by almost 18%, but that varies over time, and the price is adjusted within one day after the offering.
Semistrong-Form EMH • Results: • Price-earnings ratios and returns • Low P/E stocks experienced superior risk-adjusted results relative to the market, whereas high P/E stocks had significantly inferior risk-adjusted results • Publicly available P/E ratios possess valuable information regarding future returns • This is inconsistent with semistrong efficiency
Summary on the Semistrong-Form EMH • Studies on predicting rates of return indicates markets are not semistrong efficient. • Dividend yields, risk premiums, calendar patterns, and earnings surprises • This also includes cross-sectional predictors such as p/e ratio.
Strong-Form EMH • Stock prices fully reflect all information from public and private sources • Implication: No group of investors should be able to consistently derive above-average risk-adjusted rates of return.
Strong Form EMH • Tests: How do investors considered to be insiders perform? • Corporate insiders • Corporate insiders include major corporate officers, directors, and owners of 10% or more of any equity class of securities. • Security analysts • Professional money managers • Trained professionals, working full time at investment management
Strong-form EMH • Results: • Corporate insiders generally experience above-average profits especially on purchase transactions • Studies show that public investors who trade with the insiders based on announced transactions cannot generate excess risk-adjusted returns (after commissions).
Strong-form EMH • Results: • There is evidence in favor of existence of superior analysts who apparently possess private information: • Sell recommendations • Changes in consensus recommendations • Earnings revisions prior to earnings announcements (especially upward)
Strong-form EMH • Results: • Most tests examine mutual funds • Risk-adjusted, after expenses, returns of mutual funds generally show that funds, on average, did not match aggregate market performance
Implications of EMH on Technical Analysis • Technical analysts develop systems to detect movement to a new equilibrium (breakout) and trade based on that. • Contradicts rapid price adjustments indicated by the EMH.
Implications of EMH on Technical Analysis • Technicians believe that investors do not analyze information and act immediately - it takes time. • Therefore, stock prices move to a new equilibrium after the release of new information in a gradual manner, causing trends in stock price movements that persist for periods of time.
Implications of EMH on Technical Analysis • If the capital market is weak-form efficient, a trading system that depends on past trading data can have no value. • However… • Many managers use technical indicators as a means of narrowing down stock selection and determining buy and sell opportunities.
Implications of EMH on Fundamental Analysis • Fundamental analysts believe that there is a basic intrinsic value for the aggregate stock market, various industries, or individual securities and these values depend on underlying economic factors. • Investors should determine the intrinsic value of an investment at a point in time and compare it to the market price.
Implications of EMH on Fundamental Analysis • If you can do a superior job of estimating intrinsic value you can make superior market timing decisions and generate above-average returns. • This involves aggregate market analysis, industry analysis, company analysis, and portfolio management. • Intrinsic value analysis should start with aggregate market analysis.
Efficient Markets and Portfolio Management • Portfolio Managers with Superior Analysts • Concentrate efforts in mid-cap stocks that do not receive the attention given by institutional portfolio managers to the top-tier stocks. • The market for these neglected stocks may be less efficient than the market for large well-known stocks. • Pay attention to firm size, BV/MV, etc.
Efficient Markets and Portfolio Management • Portfolio Managers without Superior Analysts • Determine and quantify your client's risk preferences • Construct the appropriate portfolio • Diversify completely on a global basis to eliminate all unsystematic risk • Maintain the desired risk level by rebalancing the portfolio whenever necessary • Minimize total transaction costs
An Overview of Active Equity Portfolio Management Strategies • Goal is to earn a portfolio return that exceeds the return of a passive benchmark portfolio, net of transaction costs, on a risk-adjusted basis. • Practical difficulties of active manager • Transactions costs must be offset • Risk can exceed passive benchmark
Beyond Long-only Portfolios • Up to now we have considered long-only portfolios, i.e., we have not introduced the possibility of shorting asset classes and securities. • This is a reasonable starting point since many managers operate under this short-selling constraint. • However, those that are not constrained can consider: • Long-short portfolios (market-neutral strategy) • “Combination” portfolios (for example, 130/30 strategy)
Spectrum of Strategies • Indexed equity • passive strategy • Enhanced indexed equity • Active strategy that allows for over/under weight of securities • These strategies typically have minimum and maximum weight restrictions
Spectrum of Strategies • Active equity • Active strategy that allows for over/under weight of securities • These strategies do not have minimum and maximum weight restrictions • No short-selling is allowed
Spectrum of Strategies • Enhanced active equity • Active strategy that allows for overweighting and short-selling of securities. • These strategies continue to maintain (and often increase) exposure to the market.
Spectrum of Strategies • Market-neutral long-short equity • Active strategy that allows for overweighting and short-selling of securities. • These strategies do not have a net exposure to market risk.
Short-selling restrictions • In an attempt to stabilize the financial markets, the SEC implemented a temporary short-selling ban on 900 financial stocks in September. • The ban was lifted in early October. • Short-selling has declined since then: • Reduced hedge fund activity? • Uncertainty of further restrictions? • Increased use of short ETFs?
Market neutral long-short equity • A long-short portfolio is constructed to go long the markets (or securities) that are most attractive and to short the markets (or securities) that are least attractive. • Security or market selection can be based on valuations, factors (ex., book-to-market), general economic conditions
Market neutral long-short equity • Benefits of relaxing the short selling constraint: • An active manager can take full advantage of their research regarding securities that will underperform and with short-selling the potential return is considerably greater than with underweighting (in a long-only portfolio). • The manager can reduce the portfolio’s exposure to the market. • The efficient frontier can be moved outward resulting in more efficient portfolios.
Market neutral long-short equity • The benchmark against which long-short portfolio returns are measured against is usually the risk-free rate (or some other short-term cash return). • However, overall market movements do effect long-short portfolios.
Market neutral long-short equity • The original hedge funds developed long-short portfolios to “hedge” against the market. • They were very successful around the stock market crash (of 1987) because investors were not exposed to the market factor.
130/30 Equity Strategies (Enhanced active equity) • A 130/30 equity strategy is a cross between a long-only strategy and a long-short strategy. • The term ‘130/30’ refers to 130% in long positions and 30% in short positions.
130/30 Equity Strategies • Benefits: • This strategy allows managers to get the full benefit from their research, short stocks that they expect will underperform. • They can continue to maintain their market exposure (beta).