Download
1 / 53
770 likes | 1.47k Views
Introduction to Surface Water Hydrology. Philip B. Bedient Rice University 2006. The Hydrologic Cycle. Major Hydrologic Processes. Precipitation (measured by radar or rain gage) Evaporation or ET (loss to atmosphere) Infiltration (loss to subsurface soils)

E N D
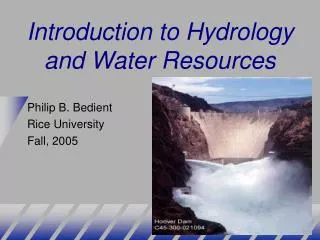
Introduction to Surface Water Hydrology Philip B. Bedient Rice University 2006
Major Hydrologic Processes • Precipitation (measured by radar or rain gage) • Evaporation or ET (loss to atmosphere) • Infiltration (loss to subsurface soils) • Overland flow (sheet flow toward nearest stream) • Streamflow (measured flow at stream gage) • Ground water flow and well mechanics • Water quality and contaminant transport (S & GW)
Recent History of Hydrology • Early 1900s saw great expansion of water supply and flood control dams in the western U.S. - in response to Dust Bowl and the Economic Depression of the 1930s • U.S. Dept of Agriculture began many hydrologic studies • Sherman UH and Horton infiltration theory 1930s • Theis well mechanics (1935) • Horton theory of infiltration (1940s) • Penman (1948) - complete theory of evaporation
Recent History of Hydrology • Great urban expansion in 1950s and 60s - led to demand for better water supply and prediction (after WW II) • EPA formed in 1970 with a mission to clean up the rivers and lakes of America - beginning of environmental eng. as we know it today • USGS and EPA actively involved in large-scale sampling programs at the national level - The Woodlands, TX • EPA funded development of computer models to address water quality issues in streams and lakes, and estuarine bays (1970s).
The Woodlands The Woodlands planners wanted to design the ultimate community to handle a 100-year storm. In doing this, they attempted to minimize any changes to the existing, undeveloped floodplain.
The Watershed or Basin • Area of land that drains to a single outlet and is separated from other watersheds by a drainage divide. • Rainfall that falls in a watershed will generate runoff to that watershed outlet. • Topographic elevation is used to define a watershed boundary (land survey or LIDAR)
Brays Bayou Watershed Harris Gully Area: 4.5 sq. mi. Brays Bayou Area: 129 sq. mi. Rice/TMC Area Watershed Boundary
Watershed Characteristics Divide • Size • Slope • Shape • Soil type - LU • Storage capacity Reservoir Natural stream Urban Concrete channel
Major Causes of Flooding(Excess Water that Inundates) • Highly Developed (urbanized) Area • Intensity and Duration of Rainfall • Flat Topography with Little Storage • Poor Building Practices in floodprone areas • No replacement of lost storage as area grows
Harris Gully Drains to Brays Bayou Low Flow Box Culvert During Tropical Storm Frances
The Watershed Response • As rain falls over a watershed area, a certain portion will infiltrate the soil. Some water will evaporate back. • Net Rainfall is available as overland flow and runs off to the nearest stream. • Smaller tributaries or streams then begin to flow and contribute their load to the main channel at confluences. • As accumulation continues, the Streamflow rises to a maximum (peak flow) and a flood wave moves downstream through the main channel. • The flow eventually recedes or subsides as all areas drain out.
. 3 0 , 0 0 0 2 5 , 0 0 0 J u n 7 6 A p r 7 9 2 0 , 0 0 0 S e p 8 3 Flow, cfs M a r 9 2 1 5 , 0 0 0 M a r 9 7 1 0 , 0 0 0 5 , 0 0 0 2 1 8 1 4 3 6 9 1 5 1 2 2 T i m e , h r s Measured Flow for Brays Bayou 29,000 cfs
Problems in Hydrology: • Extreme weather and rainfall • Streamflow and runoff predictions • River routing and hydraulic conditions • Overall water balances - local and global scales • Flood control and drought measures • Water supply for growing communities • Watershed management for agric/urban development
Applications in Hydrology: • Surface water supply and delivery systems (sewers) • Ground water for supply, wells, and springs • Contamination and environmental quality issue • Lake and Coastal Bay quality studies • River quality for drinking and recreation • Hazardous waste studies for GW contamination • Waste sources from urban/industrial runoff • Land use impacts from urban development • Disaster mitigation and flood control
Technology has Revolutionized the Field of Hydrology • High Speed Digital Computation • Geographical Information Systems (GIS) • Large Hydrologic and Meteorologic Databases • GPS and LIDAR methods for ground surveys • RADAR rainfall estimates from NEXRAD • Advanced forecasting tools for severe weather and flood Alert
A Note on Units • Rainfall volume is normally measured in inches or cm • Rainfall rate or intensity in inches/hr or cm/hr • Infiltration is measured in inches/hr or cm/hr • Evaporation is measured in inches or in/hr (cm/hr) • Streamflow is measured in cfs or m3/s • One acre-ft of volume is 43,560 ft3 of water • 1 ac-inch/hr is approx. equal to 1.008 cfs • Ground water flows are measured as ft3/day or m3/day
Rainfall and Conversion to Runoff • Use either design rainfalls or historical events • Spread uniformly over a given basin area • Use Rational Method to compute peak flow for small basin area - few hundred acres • Use Unit hydrograph to compute response for larger basins - 10 to 100 sq miles.
Rainfall and Conversion to Runoff • Rational Method predicts peak flow • Qp = C I A in cfs • C = runoff coefficient - fcn of land use • I = rainfall intensity at time of concentration Tc • A = watershed area in acres • Tc = time for water to travel from most distant pt to the outlet of a watershed
Design Rainfalls • Design Storm from HCFCD and NWS • Based on Statistical Analysis of Data • 5, 10, 25, 50, 100 Year Events • Various Durations
T.S. Allison vs. the 100-year (Inches of rainfall) 1-hr 3-hr 6-hr 12-hr 1976 TMC 3.8 7.5 9.8 10.4 Allison (a) 4.3 10.3 12.1 14.7 100-yr (b) 4.6 6.8 8.5 10.5 Diff (a–b) –0.3 3.5 3.6 4.2 Note: Allison dropped 8.5 inches in 2 hours
RADAR Rainfall Estimates • NEXRAD provides real-time data on a ~16 km2 (6 mi2) grid • Equivalent to about 21 rain gages in Brays Bayou watershed • Each estimate represents an average rainfall amount over the entire 4 x 4 km2 area • NEXRAD rainfall estimates compare well with point rain gage measurements (r2 ~ 0.9)
FAS – NEXRAD Midnight 1 a.m.
Hydrologic Theory • One of the principal objectives in hydrology is to transform rainfall that has fallen over a watershed area into flows to be expected in the receiving stream. • Losses must be considered such as infiltration or evaporation (long-term) • Watershed characteristics are important
Loss Rate Method:Initial and Uniform Loss Rate Method • Initial Amount Lost to Infiltration (in) • Uniform Loss at a Constant Rate (in/hr) Inches/Hour Example: Initial Loss = 0.5 in, Uniform Loss = 0.05 in/hr
Unit Hydrograph Theory • The unit hydrograph represents the basin response to 1 inch (1 cm) of uniform net rainfall for a specified duration, D. • Linear method originally devised in 1932. • Works best for relatively small subareas - in the range of 1 to 10 sq miles. • Several computational methods exist.
Synthetic UH Methods • Snyder’s Method (1938) • Clark Method (1945) • Nash (1958) • SCS (1964, 1975) • Espey-Winslow (1968) • Kinematic Wave (1970s)
SCSTriangular UH Example 1 inch of Net Rain over D = 1.6 hr
SCSTriangular UH Example Volume = QpTr /2 + QpB /2 Qp =2Vol/(TR + B) B = 1.67 TR Qp = 484 A / TR TR = D/2 + tp tp = L0.8 (S + 1)/ 1900 (Y)0.5 Qp TR B tp = lag time L = length to divide in ft Y = Avg basin slope in % S = 1000/CN - 10 (ins)
SCS Methods TriangularUH CN = curve number for various soil/LU See SCS Table 2.1 DimensionlessUH
Hydrograph Convolution Add and Lag Method 1 2 3 1 Q 2 FINAL STORM HYDROG 3 T Add up the ordinates of all three to produce storm hydrograph This add and lag procedure can be extended to large basins
Flow in Pipes and Channels URBAN RUNOFF • Rain falls over watershed • A portion becomes pipe flow (storm water). • The remaining portion becomes overland flow in streets and yards. • The total runoff reaches a stream and is the sum of both components Overland Flow Total Hydrograph Outflow Pipe Flow (SWWM) Pipe Flow Time
Hydraulic Calculation - Pipes (z + P/g + V2/2g)1= (z + P/g + V2/2g)2+hL E = total energy = z + P/g + V2/2g at pts 1 and 2 Energy Grade Line hL P1 Flow P2 z1 z2 Datum (MSL)
Manning’s Equation Open Channels A A A P = Wetted Perimeter Pipe P = Circum. Natural Channel
Small Watershed Response Rice Blvd Harris Gully Brays Bayou
Digital Elevation Model Based on 1999 Aerial Survey DEM Used to Determine Overland Flow Connectivity and Storage
96” 54” 66” 72” 84” 114” Existing Pipe Network 60” 90” 72” 72” 60” 60” 60” 6.5’x10’ 6.5’x10’ Rice 7.5’x11’ Hermann Park 2-11.5’x15’ 66” NEW PIPES 2-15’x15’ TMC
Bayou Camera - June 8-9, 2001Provided valuable data on water levels and timing 10 p.m. 12 p.m. 11:00 a.m
Texas Medical Center - Moursund Westbound 6/10/01 - 6:44 AM
Fannin at Holcombe Overpass - TS Allison 6/9/01 - 5:58 AM
T.S. Allison - Houston, June 9, 2001 Rice Blvd at Entrance 16 looking west Jeep indicating high water mark - inlet to Harris Gully
Southwest Freeway (US 59) Detention Storage between Mandell and Hazard Looking West Looking East
Flood Warning SystemsDowntown Houston Emergency Response • Flood Doors • Flood Gates • Facility Entrances • Communications • Operations • Training
The Woodlands - a Totally Planned Community The community was designed as if it were fully developed with minimal impacts on water. Strict requirements were made about land use and natural drainage concepts were used throughout.
Hoover Dam Facts Hoover Dam supplied farmers with dependable supply of water in Nevada, California and Arizona. Because of the Hoover Dam, the Colorado River was controlled for the first time in history.