Download
1 / 31
310 likes | 432 Views
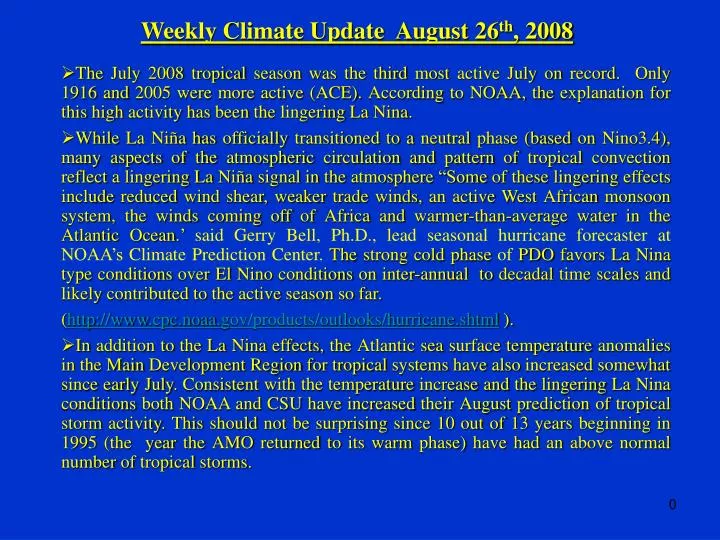
Weekly Climate Update August 26 th , 2008. The July 2008 tropical season was the third most active July on record. Only 1916 and 2005 were more active (ACE). According to NOAA, the explanation for this high activity has been the lingering La Nina.

E N D
Weekly Climate Update August 26th, 2008 The July 2008 tropical season was the third most active July on record. Only 1916 and 2005 were more active (ACE). According to NOAA, the explanation for this high activity has been the lingering La Nina. While La Niña has officially transitioned to a neutral phase (based on Nino3.4), many aspects of the atmospheric circulation and pattern of tropical convection reflect a lingering La Niña signal in the atmosphere “Some of these lingering effects include reduced wind shear, weaker trade winds, an active West African monsoon system, the winds coming off of Africa and warmer-than-average water in the Atlantic Ocean.’ said Gerry Bell, Ph.D., lead seasonal hurricane forecaster at NOAA’s Climate Prediction Center. The strong cold phase of PDO favors La Nina type conditions over El Nino conditions on inter-annual to decadal time scales and likely contributed to the active season so far. (http://www.cpc.noaa.gov/products/outlooks/hurricane.shtml ). In addition to the La Nina effects, the Atlantic sea surface temperature anomalies in the Main Development Region for tropical systems have also increased somewhat since early July. Consistent with the temperature increase and the lingering La Nina conditions both NOAA and CSU have increased their August prediction of tropical storm activity. This should not be surprising since 10 out of 13 years beginning in 1995 (the year the AMO returned to its warm phase) have had an above normal number of tropical storms.
(Continue from previous Slide) The CSU August forecasts include 17 tropical storms, 9 hurricanes and 5 intense hurricanes. NOAA predictions are for 14-18 tropical storms, 7-10 hurricanes and 3-6 major hurricanes. Dr. Gray has modified his 4 analog years (1926, 1961, 1996, 2000) to include 1926 and 1996. The 1926 tropical season includes the great Miami Hurricane. The North Atlantic Oscillation (NAO) index has been trending downward and is currently negative. A negative NAO index is associated with a greater chance of hurricane landfalls along the Gulf Coast of the U.S. and Florida [Elsner and Bossak, 2004]. The NAO has specific effects upon the Bermuda high pressure system in the Atlantic Ocean.A negative NAO allows for a weaker more westward centered Bermuda High, which acts to steer North Atlantic hurricanes toward the southern United States rather than re-curving toward the open North Atlantic [Slide 25]. http://garnet.acns.fsu.edu/~jelsner/PDF/Research/ElsnerLiuKocher2000.pdf Summary of current global ocean-climate conditions can be found at the following link: http://ioc3.unesco.org/oopc/state_of_the_ocean/all/ The CPC official climate outlook indicates an increased chance for above normal rainfall for the September through November climate window.
Table of Contents Slide 2004-2008 monthly tropical Atlantic sea surface temperature anomalies………………….............… 3 Sea Surface Temperatures Anomalies in the tropical storm Main Development Region (MDR)...… 4 2007-2008 La Nina (Nino 3.4 index)compared with other ENSO events during the past several year 5 The evolution of sea surface temperature anomalies (SSTA) in the east-central equatorial Pacific ocean………………………………………………………………………………………………...... 6 The equatorial Pacific Ocean NINO Indices ………......................……………….……………….… 7 Trend in the subsurface anomalies..………………………….….……………………………....……. 8 Current Global Sea surface temperature anomalies………….……………………….………...…….. 9 The Climate Forecasting System (CFS) sea temperature anomalies predicted.…………….……….... 10 North Atlantic Oscillation ……………………………….…………..…..………...……………….…. 11 Seasonal Probability of each phase of ENSO……………………...…………………………………. 12 The Official CPC Climate Outlook……………………….……………………................................... 13 Lake Okeechobee August 1st PA Percentiles…………………………………………………………. 14 Lake Okeechobee August 1st PA with Neutral ENSO……………….………………………………... 15 Lake Okeechobee August 1st Neutral ENSO/AMO warm phase sub samplings……………………... 16 Backup Slides
Tropical North Atlantic SST has been steadily increasing since April. • MeridionalGradient SST (TNA-TSA) is approaching zero in July. Evolution of Tropical Atlantic SST Indices
Sea Surface Temperatures Anomalies in the Tropical Storm Main Development Region (MDR) MDR MDR MDR MDR MDR (0C)
El Nino-Southern Oscillation Index NINO 3.4 2007-2008 La Ninacompared with other ENSO events since 1981. ENSO is currently in neutral conditions. http://ioc3.unesco.org/oopc/state_of_the_ocean/sur/pac/nino3.4.php
Recent Evolution of Equatorial Pacific SST Departures (o C)Climate Prediction Center El Nino-Southern Oscillation Weekly Update Nino 3.4 continues slow warming August 2007 NINO3.4 November 2007 Since February 2008, negative sea surface temperature anomalies have weakened over the central and east-central equatorial Pacific Ocean. Time July 2008 Longitude
Niño Region SST Departures (o C) Recent EvolutionClimate Prediction Center El Nino-Southern Oscillation Weekly Update The latest weekly SST departures are: Niño 4 -0.4ºC Niño 3.4 0.0ºC Niño 3 0.5ºC Niño 1+2 0.4ºC
Sub-Surface Temperature Departures (o C) in the Equatorial Pacific Ocean (August 18th , 2008) Bureau of Meteorology Research Centre May Jun Jul Aug Longitude At this time neutral conditions are in place. These conditions are likely to persist into next dry season. However, El Nino or La Nina conditions can be ruled out for the next dry season. A cool subsurface anomalies has recently appeared in the equatorial Pacific and needs to be monitored.
Latest Weekly Sea Surface Temperature Anomaly National Climate Data Center A B The Atlantic Main hurricane development region has experienced warming the past several week.
Equatorial Pacific SST and Subsurface Temperature Anomaly Forecast NCEP Climate Forecast System Issued August 25th 2008 The CFS ensemble mean (heavy blue line) predicts La Niña most likely will be in neutral conditions for the remainder of the tropical season. Regions illustrated above are the Indian, Pacific, and Atlantic tropical oceans subsurface temperature anomalies. The CFS ENSO ensemble forecast has had a significant upward shift during recent weeks.
North Atlantic Oscillation The IRI ENSO model summary supports the cfs prediction that ENSO most likely to remain in the neutral phase.
CPC Seasonal Rainfall Outlook December-February September- November
August 1st Position Analysis ENSO Neutral/AMO Warm sub sampling
PDO cold phase equals less El Nino more La Nina and drier dry seasons http://www.americanthinker.com/blog/2008/04/nasa_confirms_natural_climate.html
Currently transitioning to cold phase of PDO PDO ENSO La Ninapredominates when PDO is in negative phase El Ninopredominates when PDO is in positive phase
AO (or NAO) – North Atlantic • Larson et al. (2006, J. Climate) • The AO (and/or NAO) has a strong influence on the intraseasonal and interannual variability of NA TC activity. “During La Niña (El Niño) conditions, atmospheric circulation appears more (less) conductive to TC activity in the main developing region [MDR] during AO-positive (negative) conditions than during AO negative (positive) ones.” • An enhanced (decreased) TC activity during the positive (negative) phase of the AO. During the positive phase of the AO, • The subtropical ridge in the NA is enhanced. • The westerly wind shear weakens over the MDR. • The tropical easterly jet intensifies over Africa. → provide favorable conditions for TC development.
Composites associated strongest AMM (+) and AMM (-) Tropical cyclo-genesis points for the five strongest and five weakest AMM years, superimposed on composites of SST (shaded) and shear (contours) anomalies. Crosses show the genesis points for all storms that reached tropical storm strength. Storms that reached “major hurricane” strength (maximum sustained surface wind speed > 49 m s-1) also have a circle around their genesis point. Solid (dashed) shear contours denote positive (negative) values. The contour interval is 0.25 m s-1 and the zero-contour has been omitted. Shear was calculated every 6 h as the amplitude of the vector difference between the layer-mean winds in the 300–150 hPa and 925–700 hPa layers, and means were formed around the hurricane season from monthly means.
Moisture Percentile for July 24th , 2008 Land Surface Hydrology Research Group Princeton University http://hydrology.princeton.edu/~luo/research/FORECAST/current.php
(Discussion Related to previous Slide) The drought analysis is based on comparing the current soil moisture against the 54-yr retrospective climatology. The climatology is developed separately for each grid cell (> 55,000 cells in the USA) in the form of a pdf. The original drought analysis (Sheffield et al. 2004) fitted beta distributions to the soil moisture data. In this update a empirical distributions based directly on the data is applied. The plots shows the percentile of current soil moisture with respect to the 54-yr climatology defined as all values in a 49-day sampling window centered at 2008/07/24
Correlation between RF and Atlantic Meridional Mode and Atlantic Multidecadal Oscillation AMO AMM