Download
1 / 13
130 likes | 286 Views
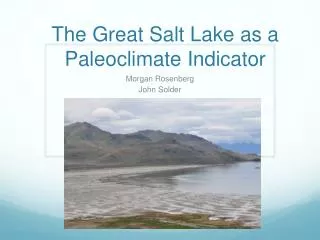
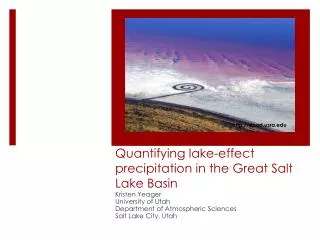
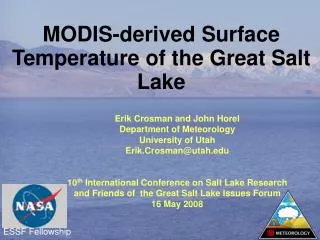
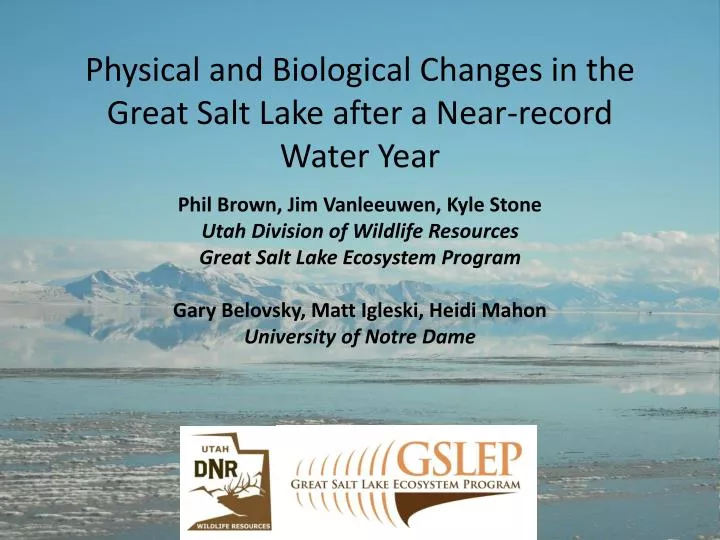
Physical and Biological Changes in the Great Salt Lake after a Near-record Water Year. Phil Brown, Jim Vanleeuwen , Kyle Stone Utah Division of Wildlife Resources Great Salt Lake Ecosystem Program Gary Belovsky, Matt Igleski, Heidi Mahon University of Notre Dame. The Great Salt Lake.

E N D
Physical and Biological Changes in the Great Salt Lake after a Near-record Water Year Phil Brown, Jim Vanleeuwen, Kyle Stone Utah Division of Wildlife Resources Great Salt Lake Ecosystem Program Gary Belovsky, Matt Igleski, Heidi Mahon University of Notre Dame
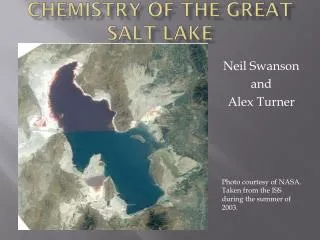
Conditions in 2010 • Lake surface elevation 4193.5 ft asl (avg is 4200) • Lowest since early 1960s • Antelope Island Marina too shallow for most vessels • Gunnison Island land bridge • Photic zone salinity ~16% • Consecutive years of evaporation exceeding inflow • No apparent effect on aquatic ecosystem
Near-record spring runoff and snowpack • Lake surface rose 5 feet • 30% increase in lake volume • 30% decrease in South Arm salinity • Lateral shoreline movement Aug 2010 July 2011
Expected biotic changes Expected changes in 2011 Dilution of epilimnetic nutrients Decrease in maximum phytoplankton abundance Potential decrease in brine shrimp abundance Shift in phytoplankton assemblage Strengthening chemocline Increased nutrient sequestration Larger anoxic zone • Data from 1994-2006 • Regression and structural equation modeling of monthly averages
Observed results—nutrients • TN concentration decreased with lake rise • NH4 remained steady • No significant change in phosphorous
Observed results—phytoplankton • Chlorophyll-a declined • Timing coincided with spring runoff. • But, disproportionately large • Occurred before brine shrimp grazing pressure • No large shift in phytoplankton assemblage • Chlorophytes remained dominant • Low proportion of cyanobacteria
Observed results—brine shrimp • Summer & fall brine shrimp densities correlated with food available during spring hatch • chl-a and shrimp low in 2011
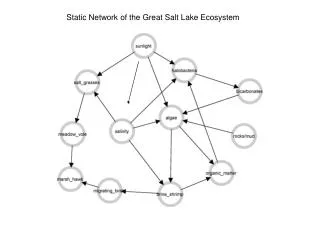
Observed results—chemocline • Anoxic monimolimnion • Known as “deep brine layer” • Railroad causeway • Expands & contracts • Mercury methylation site • Nutrient storage • High in H2S
Observed results—chemocline Carrington Bay Gilbert Bay Deep brine layer expanded, but salinity gradient did not increase
Expected Unexpected NH4 remained consistent Midwinter decline in chlorophyll unexplained Chlorophytes stay dominant • Dilution of total nutrients • Decline in brine shrimp abundance • Deep brine layer expanded into southern basin
Data interpretation • Comparison between 2 years of a 14 year dataset is problematic • Even highly significant correlations have noise • 2010-2011 salinity changes much smaller than late 1980s
Acknowledgements • United States Geological Survey—Nutrient analysis • GSLEP techs: Ben Carswell, Sarah Carver, Alan Deru