Download

1 / 5
50 likes | 186 Views
Precipitation and the Great Salt Lake. Patrick Loury and Eliana Manangòn. Precipitation and Lake Level of the Great Salt Lake (GSL). Precipitation accounts for approximately 30% of the input to GSL (Lall and Mann, 1995)

E N D
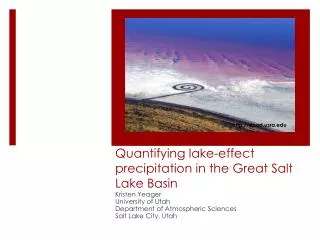
Precipitation and the Great Salt Lake Patrick Loury and Eliana Manangòn
Precipitation and Lake Level of the Great Salt Lake (GSL) • Precipitation accounts for approximately 30% of the input to GSL (Lall and Mann, 1995) • This input has an important control on lake surface elevation (Stephens, 1990) • Since 1982, about 60% of elevation increase has resulted from greater than average precipitation and less than average evaporation rates • Snow is an important component of precipitation in the Great Basin, and accounts for about 85% of total precipitation input (Baskin, et al., 2002)
Precipitation Breakdown By Watershed* • Four watersheds comprise the Great Basin: • West desert • Largest area, least precipitation • Utah Lake • One of the largest freshwater lakes in the Western U.S. • Weber River • Smallest area, most precipitation • Bear River • Contains the largest tributary contributing to GSL (Bear River) *Data from http://www.greatsaltlakeinfo.org/Background
Historical Data* Average Value: 14.98 in Standard Deviation: 3.44 in Minimum Value: 9.06 in MaximumValue: 26.64 in *Data from http://www.prism.oregonstate.edu
Precipitation Trend Over Time* • On a decadal scale, the average annual precipitation in SLC seems to be increasing • If this trend continues, the lake surface elevation will rise in response • However, the data is not certain: • Weak correlation • Relatively short time period for data collection • Large variability in data Precipitation (in) Note: For a full list of references, see handout *Data from http://www.prism.oregonstate.edu