Download
1 / 1
10 likes | 89 Views
21. 15. 9. 5. 21. 15. 9. 5. Atmospheric Motion Vectors Derived via a New Nested Tracking Algorithm Developed for the GOES-R Advanced Baseline Imager Jaime Daniels 1 , Wayne Bresky 2 , Steve Wanzong 3 , Andrew Bailey 2 and Chris Velden 3

E N D
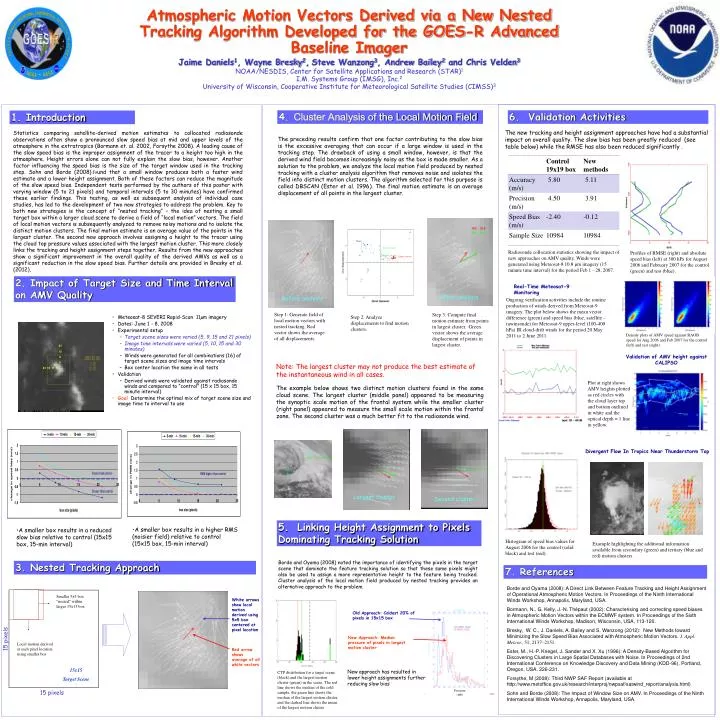
21 15 9 5 21 15 9 5 Atmospheric Motion Vectors Derived via a New Nested Tracking Algorithm Developed for the GOES-R Advanced Baseline Imager Jaime Daniels1, Wayne Bresky2,Steve Wanzong3, Andrew Bailey2 and Chris Velden3 NOAA/NESDIS, Center for Satellite Applications and Research (STAR)1 I.M. Systems Group (IMSG), Inc.2 University of Wisconsin, Cooperative Institute for Meteorological Satellite Studies (CIMSS)3 4. Cluster Analysis of the Local Motion Field 6. Validation Activities 1. Introduction The new tracking and height assignment approaches have had a substantial impact on overall quality. The slow bias has been greatly reduced (see table below) while the RMSE has also been reduced significantly . Statistics comparing satellite-derived motion estimates to collocated radiosonde observations often show a pronounced slow speed bias at mid and upper levels of the atmosphere in the extratropics (Bormann et. al. 2002, Forsythe 2008). A leading cause of the slow speed bias is the improper assignment of the tracer to a height too high in the atmosphere. Height errors alone can not fully explain the slow bias, however. Another factor influencing the speed bias is the size of the target window used in the tracking step. Sohn and Borde (2008).found that a small window produces both a faster wind estimate and a lower height assignment. Both of these factors can reduce the magnitude of the slow speed bias. Independent tests performed by the authors of this poster with varying window (5 to 21 pixels) and temporal intervals (5 to 30 minutes) have confirmed these earlier findings. This testing, as well as subsequent analysis of individual case studies, has led to the development of two new strategies to address the problem. Key to both new strategies is the concept of “nested tracking” – the idea of nesting a small target box within a larger cloud scene to derive a field of “local motion” vectors. The field of local motion vectors is subsequently analyzed to remove noisy motions and to isolate the distinct motion clusters. The final motion estimate is an average value of the points in the largest cluster. The second new approach involves assigning a height to the tracer using the cloud top pressure values associated with the largest motion cluster. This more closely links the tracking and height assignment steps together. Results from the new approaches show a significant improvement in the overall quality of the derived AMVs as well as a significant reduction in the slow speed bias. Further details are provided in Bresky et al. (2012). The preceding results confirm that one factor contributing to the slow bias is the excessive averaging that can occur if a large window is used in the tracking step. The drawback of using a small window, however, is that the derived wind field becomes increasingly noisy as the box is made smaller. As a solution to the problem, we analyze the local motion field produced by nested tracking with a cluster analysis algorithm that removes noise and isolates the field into distinct motion clusters. The algorithm selected for this purpose is called DBSCAN (Ester et al. 1996). The final motion estimate is an average displacement of all points in the largest cluster. Noise Second cluster Radiosonde collocation statistics showing the impact of new approaches on AMV quality. Winds were generated using Meteosat-8 10.8 μmimagery (15 minute time interval) for the period Feb 1 - 28, 2007. Profiles of RMSE (right) and absolute speed bias (left) at 300 hPa for August 2006 and February 2007 for the control (green) and test (blue). Largest cluster 2. Impact of Target Size and Time Interval on AMV Quality Real-Time Meteosat-9 Monitoring After analysis Before analysis Ongoing verification activities include the routine production of winds derived from Meteosat-9 imagery. The plot below shows the mean vector difference (green) and speed bias (blue, satellite – rawinsonde) for Meteosat-9 upper-level (100-400 hPa) IR cloud-drift winds for the period 20 May 2011 to 2 June 2011. Step 1: Generate field of local motion vectors with nested tracking. Red vector shows the average of all displacements. Step 3: Compute final motion estimate from points in largest cluster. Green vector shows the average displacement of points in largest cluster. Step 2: Analyze displacements to find motion clusters. • Meteosat-8 SEVERI Rapid-Scan 11µm imagery • Dates: June 1 - 8, 2008 • Experimental setup • Target scene sizes were varied (5, 9, 15 and 21 pixels) • Image time intervals were varied (5, 10, 15 and 30 minutes) • Winds were generated for all combinations (16) of target scene sizes and image time intervals • Box center location the same in all tests • Validation • Derived winds were validated against radiosonde winds and compared to “control” (15 x 15 box, 15 minute interval) • Goal: Determine the optimal mix of target scene size and image time to interval to use Density plots of AMV speed against RAOB speed for Aug 2006 and Feb 2007 for the control (left) and test (right). Validation of AMV height against CALIPSO Note: The largest cluster may not produce the best estimate of the instantaneous wind in all cases. The example below shows two distinct motion clusters found in the same cloud scene. The largest cluster (middle panel) appeared to be measuring the synoptic scale motion of the frontal system while the smaller cluster (right panel) appeared to measure the small scale motion within the frontal zone. The second cluster was a much better fit to the radiosonde wind. Plot at right shows AMV heights plotted as red circles with the cloud layer top and bottom outlined in white and the optical depth = 1 line in yellow. Divergent Flow In Tropics Near Thunderstorm Top Largest cluster Second cluster 5. Linking Height Assignment to Pixels Dominating Tracking Solution • A smaller box results in a higher RMS (noisier field) relative to control (15x15 box, 15-min interval) • A smaller box results in a reduced slow bias relative to control (15x15 box, 15-min interval) Histogram of speed bias values for August 2006 for the control (solid black) and test (red). Example highlighting the additional information available from secondary (green) and tertiary (blue and red) motion clusters. Borde and Oyama (2008) noted the importance of identifying the pixels in the target scene that dominate the feature tracking solution so that these same pixels might also be used to assign a more representative height to the feature being tracked. Cluster analysis of the local motion field produced by nested tracking provides an alternative approach to the problem. 3. Nested Tracking Approach 7. References Borde and Oyama (2008): A Direct Link Between Feature Tracking and Height Assignment of Operational Atmospheric Motion Vectors. In Proceedings of the Ninth International Winds Workshop, Annapolis, Maryland, USA. Bormann, N., G. Kelly, J.-N. Thépaut (2002): Characterising and correcting speed biases in Atmospheric Motion Vectors within the ECMWF system. In Proceedings of the Sixth International Winds Workshop, Madison, Wisconsin, USA, 113-120. Bresky, W. C., J. Daniels, A. Bailey and S. Wanzong (2012): New Methods toward Minimizing the Slow Speed Bias Associated with Atmospheric Motion Vectors. J. Appl. Meteor., 51, 2137–2151. Ester, M., H.-P. Kriegel, J. Sander and X. Xu (1996): A Density-Based Algorithm for Discovering Clusters in Large Spatial Databases with Noise. In Proceedings of 2nd International Conference on Knowledge Discovery and Data Mining (KDD-96), Portland, Oregon, USA, 226-231. Forsythe, M (2008): Third NWP SAF Report (available at http://www.metoffice.gov.uk/research/interproj/nwpsaf/satwind_report/analysis.html) Sohn and Borde (2008): The Impact of Window Size on AMV. In Proceedings of the Ninth International Winds Workshop, Annapolis, Maryland, USA. Smaller 5x5 box “nested” within larger 15x15 box White arrows show local motion derived using 5x5 box centered at pixel location Old Approach: Coldest 20% of pixels in 15x15 box New Approach: Median pressure of pixels in largest motion cluster 15 pixels Local motion derived at each pixel location using smaller box Red arrow shows average of all white vectors 15x15 Target Scene New approach has resulted in lower height assignments further reducing slow bias CTP distribution for a target scene (black) and the largest motion cluster (green) in the scene. The red line shows the median of the cold sample, the green line shows the median of the largest motion cluster, and the dashed line shows the mean of the largest motion cluster Pressure (mb) 15 pixels