Download
1 / 15

E N D
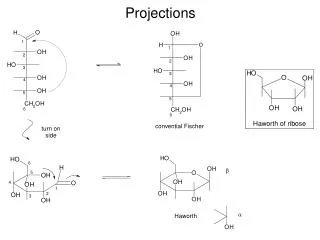
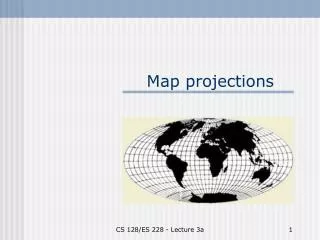
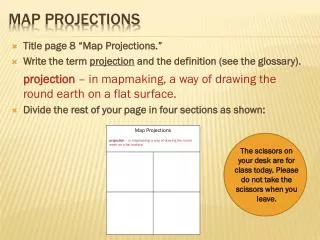
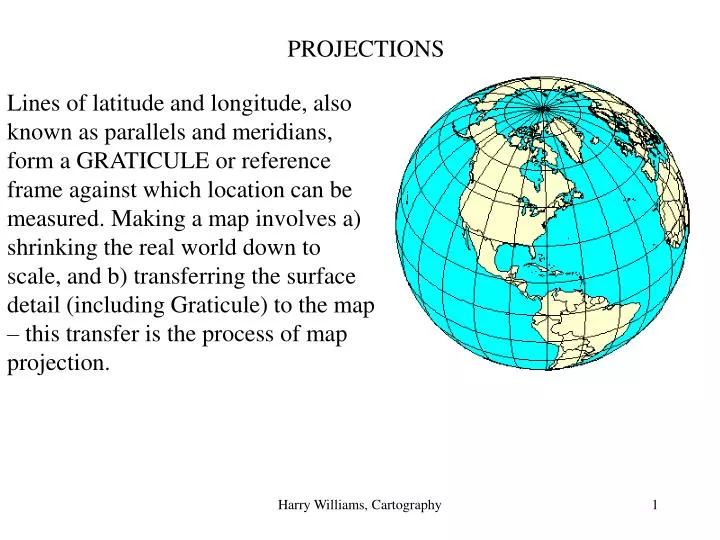
PROJECTIONS Lines of latitude and longitude, also known as parallels and meridians, form a GRATICULE or reference frame against which location can be measured. Making a map involves a) shrinking the real world down to scale, and b) transferring the surface detail (including Graticule) to the map – this transfer is the process of map projection. Harry Williams, Cartography
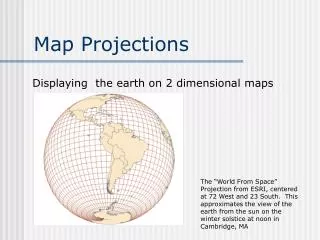
The problem is that transferring the curved surface of the earth to a flat map causes distortion in one or more of the following:- Distance- Direction- Area- Shape Certain properties can be deliberately preserved: CONFORMAL PROJECTIONS (or Orthomorphic) preserve correct shape over small areas. EQUIVALENT PROJECTIONS (or Equal-area) preserve correct area. Harry Williams, Cartography
The Three Basic Types of Projection. A. AZIMUTHAL (or Zenithal) – projected onto a flat piece of paper. Distortion increases away from contact point. Shows only part of globe. Popular for polar regions. Harry Williams, Cartography
B. CONIC – projected onto a cone, which is then “unrolled”. Distortion increases away from line of contact (Standard Parallel). Shows only part of globe. Popular for middle latitudes. If the cone is made a little smaller than the globe (mathematically), it cuts through the globe producing two standard parallels – this is the SECANT position. Harry Williams, Cartography
C. CYLINDRIC – projected onto cylinder, which is “unrolled”. Distortion increases away from Standard Parallel. Shows most of globe. Popular for world maps. Example 1: Plate Carree (Eratosthenes’ map). Parallels stretched almost 500% at 80 degrees lat. Shape and area both incorrect. Most straight lines are NOT rhumb lines – poor for navigation. Also called unprojected latitude and longitude. Harry Williams, Cartography
Example 2. Mercator (1569). Modified the Plate Carree by stretching the meridians to match stretch of parallels. Result = rhumb lines ARE straight lines – good for navigation. Problem = distortion is even worse e.g. Greenland is only 1/10 the area of South America. Harry Williams, Cartography
There are many variations on the three basic types of projection, almost without exception derived mathematically to be conformal or equivalent. Example – the Sinusoidal Projection, based on the Plate Carree, but with correctly-scaled parallels. Although highly distorted, it is an equivalent projection. Harry Williams, Cartography
Why are projections important? 1. You almost always have to have one (the exception is surveying small areas (<10km) when you can treat the earth as flat and fix locations by X and Y coordinates – a “Non-earth” projection). 2. If you mix projections, large errors can result (Note: most GIS’s will warn you if you try to do this). If you combine maps from different sources, you may have to convert them into the same projection to make them compatible. Harry Williams, Cartography
Geodetic Datums Coordinate systems, such as latitude and longitude must have a “starting point” or “geodetic datum”. Geodetic datums define the size and shape of the earth and the origin and orientation of the coordinate systems used to map the earth. Datums have evolved from those describing a spherical earth to ellipsoidal models derived from years of satellite measurements. Why is this important? The earth is not really spherical, it is closer to an ellipse and so degrees of latitude are not exactly equal. For very precise positioning (e.g. GPS) an accurate model of the shape of the earth must be used. An ellipsoidal model of the earth can be defined by a semi-minor axis (polar radius) and semi-major axis (equatorial radius). Harry Williams, Cartography
Widely-used “reference” ellipsoids are identified by a name and often by a year. Geodetic datums incorporate an earth model (such as one of these ellipsoidal models), an origin (“starting point”) and an orientation (e.g. a definition of “north”). Harry Williams, Cartography
There are hundreds of datums, because many countries have developed their own for mapping purposes. In North America, the North American Datum was established in 1927 (NAD27). This datum was established at Meade’s Ranch, Kansas; approximately the geographic center of the 48 states and was based on the 1866 Clark ellipsoid. When NAD27’s accuracy was found to be inconsistent by more modern surveying practices, a new datum was developed: the North American Datum of 1983 (NAD83). NAD83 incorporates a different ellipsoid model (the Geodetic Reference System 1980 ellipsoid). This causes significant differences between NAD27 and NAD83 coordinates (e.g. up to 100 m in parts of California). A popular GLOBAL datum is the World Geodetic System 1984 (WGS84). This is used for GPS (and other purposes). Harry Williams, Cartography
How do know the coordinate system and datum for maps you obtain? The information should be in the Metadata (data about the data). Here’s an example from ESRI. Harry Williams, Cartography