Download
1 / 14
140 likes | 227 Views
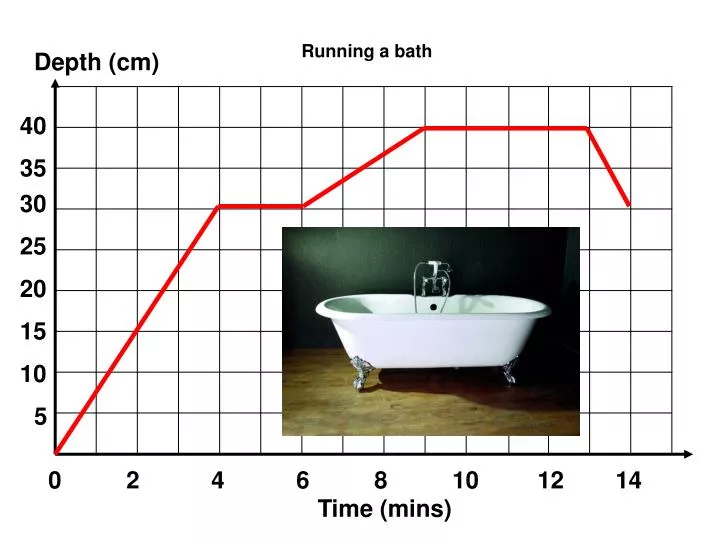
Running a bath. Depth (cm). 40. 35. 30. 25. 20. 15. 10. 5. 0. 2. 4. 6. 8. 10. 12. 14. Time (mins). A BRISK WALK. metres. 40. 35. 30. 25. 20. 15. 10. 5. 0. 2. 4. 6. 8. 10. 12. 14. Seconds. ON YER BIKE!. metres. 40. 35. 30. 25. 20. 15. 10. 5. 0. 5.

E N D
Running a bath Depth (cm) 40 35 30 25 20 15 10 5 0 2 4 6 8 10 12 14 Time (mins)
A BRISK WALK metres 40 35 30 25 20 15 10 5 0 2 4 6 8 10 12 14 Seconds
ON YER BIKE! metres 40 35 30 25 20 15 10 5 0 5 10 15 20 25 30 35 Seconds
HOMEWARD BOUND metres 40 35 30 25 20 15 10 5 0 2 4 6 8 10 12 14 Seconds
LETS MEET UP metres 40 35 30 25 20 15 10 5 0 2 4 6 8 10 12 14 Seconds
TRAVEL GRAPHS A man begins a journey at midday and drives 120 miles in 4 hours. He stops for 3 hours, then continues on the same path for a further 5 hours until he reaches his destination which is 400 miles from his starting point.
TRAVEL GRAPHS miles 400 350 300 250 200 150 100 50 Midday 2pm 4pm 6 8 10 12am Time
TRAVEL GRAPHS 1. Calculate the fastest leg of the journey. 2. Calculate the average speed of the journey.
TRAVEL GRAPHS A second car sets off at 6pm at a steady speed of 80mph for 400 miles. Draw this journey on the diagram. At what time are the cars together?
TRAVEL GRAPHS miles 400 350 300 250 200 150 100 50 Midday 2pm 4pm 6 8 10 12am Time
SPEED CALCULATIONS miles 32 28 24 20 16 12 8 4 0800 0810 0820 0830 0840 0850 0900 0910 Time
TRAVEL GRAPHS 1. Calculate the speed of each part of the journey. Red line = mph Blue line = mph Green line = mph
SPEED CALCULATIONS miles 32 28 24 20 16 12 8 4 0800 0810 0820 0830 0840 0850 0900 0910 Time
TRAVEL GRAPHS 1. Calculate the speed of each part of the journey. Red line = mph Blue line = mph Green line = mph