Download

1 / 10
100 likes | 229 Views
Running a race. By: Ahmed Al Jaidah, Ali A Khulafi and Charon Dias. Introduction. Our Investigation was to find out how would we design an equal race so everyone would get a chance to win. We chose players running from 1-8 km a one hundred meter race.

E N D
Running a race By: Ahmed Al Jaidah, Ali A Khulafi and Charon Dias
Introduction • Our Investigation was to find out how would we design an equal race so everyone would get a chance to win. We chose players running from 1-8 km a one hundred meter race. • We were thinking of a way to make a race so everyone had a chance to win. It was a good way but not so good when it comes to real life racing on a field.
Get ready contestants… • Here are our Contestants!
Sounded A little Confusing? Lets look at it visually!
*Important Point! * (The actual race line on a computer screen in 10cm long so we are converting 10 cm to 100m.) Player B starts 12.5 meters after Player C and 12.5 meters before player A Player C starts the race with 75 meters to run. Player F Stars 12.5 Meters After player G Player G starts halfway through Player E. Player D starts 12.5 meters After player D Player E Starts halfway From Player A Player H starts Halfway Through Player G Player A starts at 100m because he is the fastest At 8km.
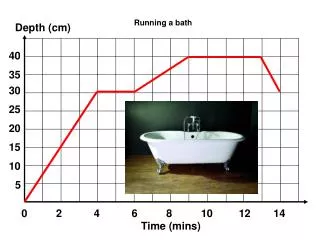
Lets make a 200 meter race table All we have to do is double the distances placed at
200 meter distance starts I can see from this graph that all the distances are going up by 25m because 12.5m X 2 =25. To make 400 meters all you have to do is multiply these times by two to get the next Places the racers should be kept.
Is this formation a fair test? Mathematically Speaking Realistically Speaking But realistically speaking this is an unfair test because in a real race not everyone runs at the same speed. The race would also be unfair if the person at first runs far and then slows down during the end. In the end the fastest person has to work the hardest because they have to run 100m while the slowest person only run 12.5m • If we are speaking mathematically, all racers should come in first place. The reason is because all the racers are placed on the running track by their speeds. • This is a good mathematical concept because in the end all people should land up at the finish line together.
Conclusion • In the end at the end of the day it is whether you look at this from a mathematical side or a realistic view. As math is more about patterns but in real life the runner does not run at a constant speed of 8km an hour for a 100m race.