Download
1 / 109
1.09k likes | 1.25k Views
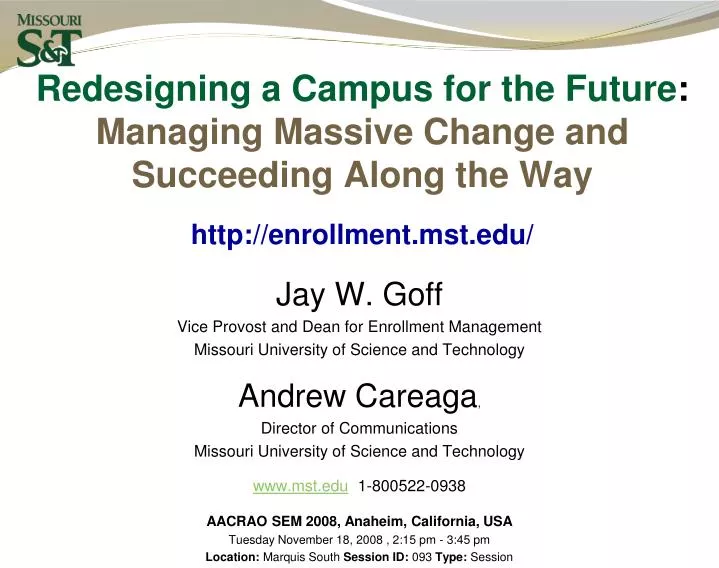
Redesigning a Campus for the Future : Managing Massive Change and Succeeding Along the Way http://enrollment.mst.edu/. Jay W. Goff Vice Provost and Dean for Enrollment Management Missouri University of Science and Technology Andrew Careaga , Director of Communications

E N D
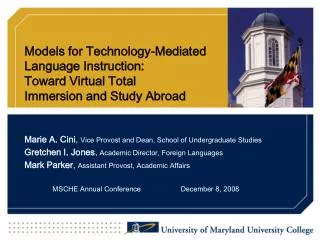
Redesigning a Campus for the Future: Managing Massive Change and Succeeding Along the Wayhttp://enrollment.mst.edu/ Jay W. Goff Vice Provost and Dean for Enrollment Management Missouri University of Science and Technology Andrew Careaga, Director of Communications Missouri University of Science and Technology www.mst.edu 1-800522-0938 AACRAO SEM 2008, Anaheim, California, USA Tuesday November 18, 2008 , 2:15 pm - 3:45 pm Location: Marquis South Session ID: 093 Type: Session
Session highlights & deliverables • Managing and directing change using strategic enrollment management principles • Effective decision models • Analytical tools and methods • Effective communication strategies • Buy-in • Success!
STILL TRUE? “University politics are vicious precisely because the stakes are so small.” -Henry KissingerUS diplomat & Harvard scholar
Present and Future Change • There will be as much change in the next three decades as there was in the last three centuries. • Every two or three years, the knowledge base doubles. • Every day, 7,000 scientific & technical articles are published. • Satellites orbiting the globe send enough data to fill 19 million volumes in the Library of Congress – every two weeks. • High school graduates have been exposed to more information than grandparents were in a lifetime. SOURCE: Leadership and Technology, the National School Boards Association's Institute for the Transfer of Technology to Education
Is Change Needed in Academia? • "Thirty years from now the big university campuses will be relics….. (Residential) Universities won't survive. It's as large a change as when we first got the printed book.“ -Peter Drucker Forbes, June 16, 1997 • Academia (business schools in particular) need to respond to the wake-up call and recognize that inflexibility and the failure to respond quickly and decisively to environmental change can be dangerous. -Andrews, Flanigan and Woundy (2000)
The only person who likes change is a wet baby. Attributed to Mark Twain
Change is inevitable – except from a vending machine. Author unknown
The External Environment in which Colleges and Universities Operate is Changing Quickly • Dramatic changes in student markets and academic interests. • Public expectations for a wide variety of high quality student services. • Greater needs for an institution-wide understanding of how to best react to the emerging student trends, needs and markets.
Who is Responsible for Leading Change in Higher Education? • Administration’s (management’s) responsibility is to detect trends so as to be able to identify changes and initiate programs that best position the institution to succeed in the near and distant future. Donald Schön, Author of The Reflective Practitioner.
The Role of Management in Succeeding through Change • It is important to estimate what impact a change will likely have on employee behavior patterns, work processes, technological requirements, and motivation. • Management must assess what constituent reactions will be and craft a change program that will provide support as workers go through the process of accepting change. • The program must then be implemented, disseminated throughout the organization, monitored for effectiveness, and adjusted where necessary. • Donald Schön
How and When Do We Make Most Major Strategic Changes? • Times of Duress: Emergencies, Disasters or Periods of ongoing Failure to Perform • External Pressure: Legislative Mandates, Governing Board Initiatives, New Professional Standards • Engaged Leadership: Understanding Future Needs and the use of Strategic Planning for Future Success
The Benefits of being a “Learning Organization” • The inherent nature of organizations are to be conservative and protect themselves from change. • Due to the increasing pace of needed change (technology, gov’t regs, shifting markets, etc.) , it is more important for organizations to embrace a culture or change process that promotes “flexibility”. • Donald Schön recognized that an organizational culture that embraces the process of “learning” is also the one that values new ideas and on-going improvement. Schön, D. (1974). Beyond the Stable State. Public and private learning in a changing society. Penguin. Schön, D. (1983). The reflective practitioner. Basic Books
Core Market Challenges: Changes in the college-bound student markets The Midwest will experience a 4% to 10% decline in high school graduates between 2007 – 2012(Source: WICHE, 2003: Knocking at the College Door) The profile of college-bound students is rapidly becoming more ethnically diverse and female dominant(Source: NCES, 2005; WICHE, 2003) The number of students interested in engineering, computer science, and natural science degrees has declined to record lows(Source: ACT, 2003: Maintaining a Strong Engineering Workforce Policy Report; National Academies, Rising Above the Gathering Storm, 2006) More full-time college freshmen are choosing to start at two-year colleges(Source: US Department of Education IPEDS. 2005; Source: Missouri Department of Higher Education, 2005) More students are enrolling in more than one college at a time(Source: National Student Clearinghouse, 2005; Noel Levitz, 2004; College Board, 2007) Future student market growth will include more students requiring financial aid and loans to complete a degree (Source: WICHE, 2008)
Mission The mission of Missouri S&T is to integrate education and research to solve problems for our state and the technological world. Vision The vision of Missouri S&T is to be one of the top five technological research universities.
7 Years of Strategic and Dramatic Changes January 1, 2008 University Name Change 2007 Academic Reorganization by Eliminating Schools and Colleges 2003 and 2007 Updated the Mission, Vision and Strategic plans. 2004 Office of Technology Transfer and Economic Development 2001 to 2005 New Student and Business Information Systems 2002, 2004 & 2007 Three New Homepages and Platforms 2003 Student Diversity Initiative The new goals resulted in three new units and champions: • Student Diversity Programs, • Women’s Leadership Institute • Center for Pre-College Programs. 2002 New School of Management and Information Sciences 2002 Center for Education Research and Teaching Innovation (CERTI) 2002 - 2006 12 NEW Degree Programs and 19 Certificate Programs, 128 hour limited for BS Engineering Degrees 2001 Administrative Restructuring and Formal Enrollment Management Program • Enrollment Management, • Distance and Continuing Education • Research and Sponsored Programs • Undergraduate and Graduate Programs
SEM in ACTION: Why Change the University Name? “Missouri S&T will better define the university as a leading technological research university. We believe the new name will help to differentiate this university in a highly competitive university market and provide a national competitive advantage.” Dr. John F. Carney, III Missouri S&T Chancellor
Fall 2008 All Students by Academic Field Missouri S&T: 90% Engineering, Science, & Computing Majors
College Going Rate Continues to Decline WICHE, 2008
High School Seniors: 61,378 High School Graduates: 57,573 ACT Testers/College Bound: 42,862 Any Engineering Interest, all scores: 1,599 Engineering Interest, +21 comp. score: 1,102 (21 = MO average score / 50%) Engineering Interest, +24 comp. score: 807 (24 = UM minimum for auto admission) UMR’s Freshmen Engineering Majors 520 from Missouri Missouri’s 2004-05 Student Funnel for All Engineering Fields
> 5% SOURCE: ACT
U.S. Technological Research Universities Average enrollment is 6,457 Average enrollment: 5,615
Missouri S&T…… A Top 50 Technological Research University 6300 students: 4900 Undergrad, 1400 Graduate 90% majoring in Engineering, Science, Comp. Science Ave. Student ACT/SAT: upper 10% in nation +60% of Freshmen from upper 20% of HS class 20% Out of State Enrollment 96% 5 Year Average Placement Rate within 3 months of Graduation Ave. Starting Salary in 2008: +$55,000
A Top Public University Missouri S&T ranked 54th among the nation’s top public universities (U.S. News & World Report, 2008 America’s Best Colleges Guidebook, September 2008). Top 15 Public Colleges for Getting Rich #1 in the Midwest! Missouri S&T ranked 12th on Forbes magazine’s list of “Best Public Colleges for Getting Rich” (www.forbes.com, Aug. 2008) Top 20 STEM Research University Missouri S&T named in Academic Analytics’ “Top 20 Specialized Research Universities - STEM” (www.academicanalytics.com, Jan. 2008) Top 25 Starting Salaries #1 in the Midwest! Missouri S&T named in payscale.com’s list of highest average starting salaries for graduates (www.payscale.com, Aug. 2008) Top 25 Entrepreneurial Campus Missouri S&T ranked 22nd on Forbes ‘s list of “America’s Most Entrepreneurial Campuses” (www.forbes.com , Oct. 22, 2004). Top 25 Connected Campus Missouri S&T named in Princeton Review’s “America’s 25 Most Connected Campuses” (www.forbes.com, Jan. 19, 2006). Top 30 Safest College Campuses Missouri S&T ranked #27 in Reader’s Digest’s “Campus Safety Survey” (www.rd.com, 2008). Top 50 Engineering School Missouri S&T ranked 48th among the nation’s best engineering schools (U.S. News & World Report, 2007 America’s Best Colleges Guidebook, September 2006). Top 65 Public Educational Value Missouri S&T ranked 62nd among America’s public universities by Kiplinger.com’s “2008 Best Values in Education,” (www.kiplinger.com, 2008).
“We are what we repeatedly do. Excellence, therefore, is not an act but a habit.” -Aristotle
8 Year Decline New Students (-700 students) 40% Institutional Discount Rate 52% Graduation Rate 82% Retention Rate 22% Female Enrollment 8% Minority Student Enrollment Industry Asking for MORE Graduates Enrollment Concerns 2000-2001
Truly One of the Largest &BEST EVER Classes!! CONGRATULATIONS on Attracting an Outstanding Class and Exceeding the Goals
RI 1 - 9 students No students 49 Fall 2008 1 5 Legend 7 2 2 21 40 or more students 4 3 15 12 16 10 - 39 students 1 2 15 5 26 11 43 5 21 14 1 430 2 16 22 5 2 DC 58 4,433 124 17 16 9 23 21 54 61 2 6 11 19 16 Total Enrollment • 47 states & 51 nations • 70% Missouri residents • 10% minority students • 9% international students 115 9 3 12
6 Year Increase (+1,745 students) 27% Institutional Discount Rate (+$21M in additional annual revenue) 61% Graduation Rate 87% Retention Rate 22% Female Enrollment (+369) 10% Minority Student Enrollment (+278) Record New Student Classes & Student Success Industry STILL Asking for MORE Graduates Enrollment Status 2007-2008
Silver Bullet OR Strike of Lightening?
Strategic Enrollment Management Plan 2007-2011 Increase Success of Students Retention Rates Graduation Rates Increase College Going Rate & Access Access & Affordability Pipeline of College Ready Students Strategic Partnerships Outreach/Education Scholarships Expanding Current Markets & Capturing New Markets Out-of-state students Transfer Students Female Students Underrepresented Minority Students International Students Graduate Students Nontraditional Students
We Learned About Our Students Average Age: 21.8 years old Gender: 23% Female 77% Male First Generation College Students: 2005-06: 37% Residency: Missouri Residents: 76% Out-State Students: 22% International: 2% Ethnicity: African-American: 4% Asian-American: 3% Caucasian: 83% Hispanic: 2% Native-American: 1% Non-resident, International: 2% Not Disclosed: 5% From a Community <40,000: 53% Average Family Income: $73,000 USD Average Indebtedness at Graduation: $21,000 USD approx. High Financial Need (Pell qualifier): 24% Freshmen with Credit Cards: 24% 6 arrive with over $1000 USD standing balance Students with PCs: 94% +70% laptops 9% Macs Students with Cell Phones 97%
UndergraduateGraduate 2003 $ 47,305 $ 52,744 2004 $ 46,567 $ 52,945 2005 $ 49,181 $ 53,042 2006 $ 51,059 $ 58,120 2007 $ 53,669 $ 62,751 2008 $ 55,975 $ 63,640 Starting Salaries
10 Core Recruitment Changes • Creation of Data and Market Driven Strategic Plan • Assigning Executive Officers to be in Charge of Enrollment, Recruitment, Retention, and Student Assessment • Embracing an Integrated Branding Program and New Communication Series focusing on Outcomes and Fun, without reinforcing science and engineering stereotypes • Engaging the entire campus (unit by unit) in worthwhile recruiting activities • Creation of Reward Balanced and Yield Focused Scholarship Program to Lower the Discount Rate, Raise Enrollment, and Maintain Student Quality • Providing accurate and timely processing of inquiry requests and applications • Collaborating with Outreach and Public Relations Efforts • Expanding Campus Visit and Summer Camps • Campus Signage, Beautification and Landscaping Plan • Replacing and Updating Core Campus Buildings and Facilities ($140 M)
STUDENT RETENTION Since 2004, 60% of Growth due to Retention Increase Graduation Rates 20002005 General Student Body: 52% 64%
“the list of 35”Changes to Improve RetentionRetention Strategies and Tactics 2001-2008 I. Assessment EnhancementsII. ProgrammingIII. Policy Changes
Creation of a formal Institutional Research Office, 2001 Started annual retention audit of academic (cognitive) and demographic factors, 2001 Identified classes with very low student success rates (DFW), 2001 Creation of Standardized Retention and Graduation Reports by gender and ethnicity, 2002 Instituted a new student profile and expectations survey, 2002 Re-instituted the HPI assessment to track students by Non-cognitive factors, 2002 Revised withdraw surveys & interviews, 2002 Started non-returning follow-up telephone surveys, 2002 Started collection and campus-wide distribution of freshman academic profile, specifically new student survey data: expectations, social activities, GPA,ACT/SAT scores, 2002 Started measuring stop-out rate: students who withdraw and return, 2003 Revised nationally normed student profile, attitude and engagement assessments (CIRP & NSSE), 2003 Revived student satisfaction survey (switched from ACT to Noel Levitz), 2007-08 Missouri S&T’s Retention Plan I. ASSESSMENT ENHANCEMENTS
II. PROGRAMMING: Focus on Advising, tutoring, learning communities, faculty training and support Provided a public expectation of student success (VERY IMPORTANT). Addressed expectations of student success in all recruitment and orientation speeches (Chancellor – look to your left, look to your right), 2001-02 Learning Enhancement Across Disciplines (LEAD) tutoring program expanded beyond Physics, Fall 2002 Address group building (making friends) and study skills (not flunking out) in all orientation activities, 2002-2003 Online tutor request program, 2003 Distribution of student profiles and survey summaries to create a better understanding of faculty and student expectations. Actively embrace the “social norming” concept. 2003 Distribution of student profiles and survey summaries to create a better understanding of faculty and student expectations. Actively embrace the “social norming” concept. 2003 Restructured Opening Week activities around a group project activity and to address core learning objectives and student fears (Making Friends and Flunking Out) , 2002 & 2003 Provided ACT’s EIS & AIM student profile data bases to all academic departments for more intrusive advising, 2003 Joint Academic Management (JAM) Sessions (student to student tutoring) to assist low performing students, 2004
II. Programming Continued New on-line Early Warning System, 2005 Strategic Retention Intervention: Focus on a rapid response “Academic Alert System” (2005), on-line student communication system “Success Chain” (2005-2006), advisor engagement (training sessions and awards, 2002) and more quantitative knowledge of S&T student strengths (Sharing of student profiles and new student survey data prior to beginning of academic year, 2002) Creation and expansion of Learning Communities & First Year Experience Programs: Focus to address student academic skills development and social engagement through group student life oriented events, 2002-2003 Pre-College Transition Programs: Focus to promote greater student preparation to meet student and S&T academic expectations through a 3-week intense course – Hit the Ground Running (HGR) and creation of the Center for Pre-College Programs (CPCP) to expand the K-12 student workshops and STEM summer camps, 2003-04 Creation of the Center for Educational Research and Teaching Innovation (CERTI): Focus to address improving the S&T learning environment and student learning outcomes through collaborative learning, experiential learning, technology enhanced learning and educational research practices, 2003-04 Expanded Experiential Learning Programs: Focus to promote greater campus-wide “learning by doing” student engagement through student design teams, undergraduate research (OURE expansion), and service learning participation, 2002-ongoing Creation of formal first-year experience office and staff, 2008 Creation of formal second-year experience office and staff, 2008