Download
1 / 13
130 likes | 216 Views
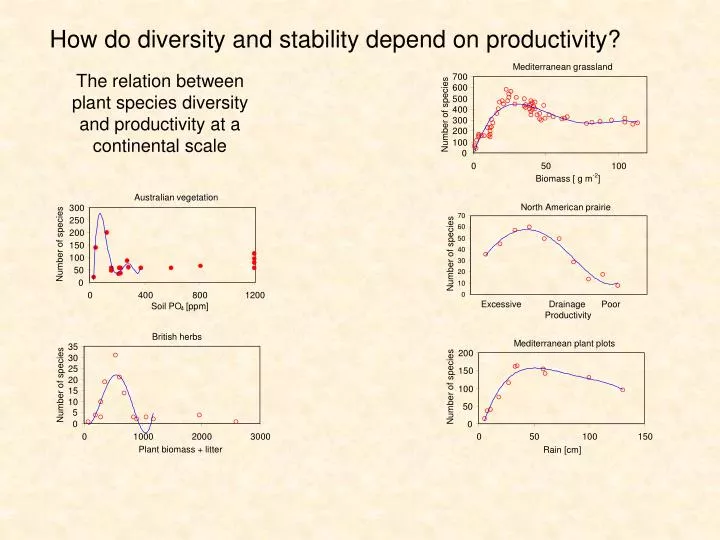
Mediterranean grassland. 700. 600. 500. 400. Number of species. 300. 200. 100. 0. 0. 50. 100. -2. Biomass [ g m. ]. Australian vegetation. North American prairie. 300. 70. 250. 60. 200. 50. Number of species. 150. 40. Number of species. 100. 30. 50. 20. 0. 10. 0.

E N D
Mediterranean grassland 700 600 500 400 Number of species 300 200 100 0 0 50 100 -2 Biomass [ g m ] Australian vegetation North American prairie 300 70 250 60 200 50 Number of species 150 40 Number of species 100 30 50 20 0 10 0 400 800 1200 0 Excessive Drainage Poor Soil PO [ppm] 4 Productivity British herbs Mediterranean plant plots 35 200 30 25 150 20 Number of species Number of species 100 15 10 50 5 0 0 0 1000 2000 3000 0 50 100 150 Plant biomass + litter Rain [cm] How do diversity and stability depend on productivity? The relation between plant species diversity and productivity at a continental scale
Atlantic cumaceans 35 30 25 20 Number of species 15 10 Productivity 5 0 0 1000 2000 3000 4000 5000 Depth [m] Tropical mammals Texas carnivores 50 20 40 18 30 16 Number of species Number of species 20 14 10 12 0 10 0 50 100 150 200 0 1000 2000 3000 Productivity Productivity The relation between animal species diversity and productivity at a continental scale
250 Palearctic birds 200 150 S 100 50 0 0 500 1000 1500 Evapotranspiration 250 Palearctic butterflies 200 150 S 100 50 0 0 500 1000 1500 Evapotranspiration Evapotranspiration is the sum of evaporation and transpiration, hence the total amount of water going from living organismas and the soil into the atmosphere. It is a measure of total energy input
Bird species numbers are correlated with annual evapotranspiration and temperature.
Fish species richness scales significantly with altitude and maximum depth of a lake Lake volume is of minor importance
Main determinants of fish species richness were annual PET, altitude, and lake area.
From local to global patterns of energy use of single species Define: D: population density W: individual body weight PET: potential evapotransiration M: individual metabolic rate (energy use) T: temperature Empirical results Population energy use scales to body weight to -0.25 to 0.25, hence is roughly constant Energy equivalence rule Population densities should decrease with evapotranspiration Population energy use decreases or increases with evapotranspiration Often it will be roughly constant Population densities should decrease with increasing temperature
If total biomass is at least stable or increases with evapotranspiration we can introduce species richness into the previous equations Species richness should nonlinear increase with potential evapotranspiration
14 Total biomass 12 Total energy use 10 8 log (factor) Population energy use 6 4 2 Individual energy use 0 0 0.5 1 1.5 2 10 Potential evapotranspiration [m / yr] Population density 8 Population biomass 6 log (factor) 4 Species richness 2 Individual body weight 0 0 0.5 1 1.5 2 Potential evapotranspiration [m / yr] Global patterns in energy use and population characteristics in mammals as derived from the compilation of Currie and Fritz (1993).
The influence of productivity on the species richness of plants Gillman, Wright (2006)
Productivity and stability Are tropical populations more stable than populations in temperate or arctic regions? There is no general latitudinal trend in population variability Vazquez, Stevens 2004
Today’s reading Global patterns in biodiversity: www.uesc.br/cursos/pos_graduacao/especializacao/biologia_florestas/insightnaturepadroes.pdf Diversity and stability: www.biology.lsu.edu/webfac/kharms/12DivStabDivProd.ppt