Download
1 / 64
640 likes | 738 Views
“ Delaying or accelerating the degenerative diseases of aging ” MCB 135K Lecture 4, Chapters 5 & 6 Dr. Bruce N. Ames 1/30/08. “ Research found that a central factor in aging is the decay of the mitochondria in cells ”.

E N D
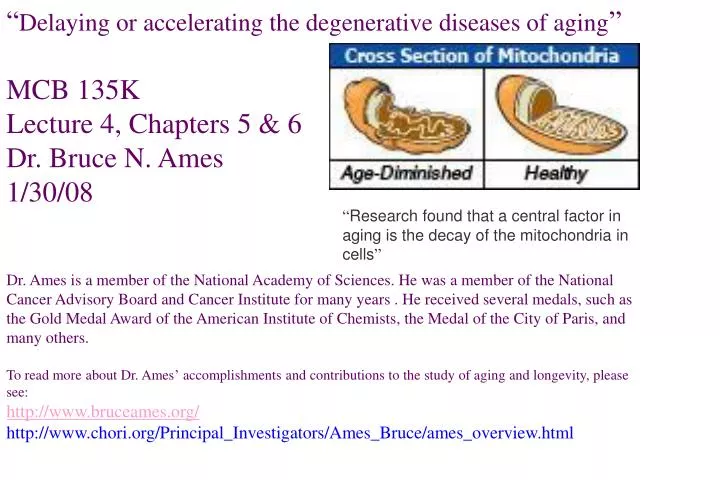
“Delaying or accelerating the degenerative diseases of aging” MCB 135K Lecture 4, Chapters 5 & 6 Dr. Bruce N. Ames 1/30/08 “Research found that a central factor in aging is the decay of the mitochondria in cells” Dr. Ames is a member of the National Academy of Sciences. He was a member of the National Cancer Advisory Board and Cancer Institute for many years . He received several medals, such as the Gold Medal Award of the American Institute of Chemists, the Medal of the City of Paris, and many others. To read more about Dr. Ames’ accomplishments and contributions to the study of aging and longevity, please see:http://www.bruceames.org/ http://www.chori.org/Principal_Investigators/Ames_Bruce/ames_overview.html
e- e- e- e- H2O O2 O2- H2O2 •OH Delaying (or Accelerating) the Degenerative Diseases of Aging Bruce N. Ames 30 Jan ‘08 Timiras class Children’s Hospital Oakland Research Institute Professor, University of California, Berkeley
Estimated oxidative DNA adducts per rat liver cell Old (26-mo) 70,000 60,000 67,000 50,000 40,000 30,000 Young (4-mo) 20,000 24,000 10,000 0
2 1 0 carbonyl content (nmol/mg protein) carbonyl content (nmol/mg protein) 6 5 4 3 2 * 0 40 60 80 100 20 3 12 20 26 Years Months Source: E. Stadtman, Science 257, 1220-1224 (1992)
160 140 120 100 80 60 40 20 0 MDA (pmol/mg protein) Young Old * * * * * Brain Liver Heart Kidney Lung 6
Proc. Natl. Acad. Sci. USA Vol. 91, pp. 10771-10778, November 1994 Review Oxidative damage and mitochondrial decay in aging (bioenergetics / mitochondrial DNA / cardiolipin / acetyl-L-carnitine / neurodegeneration) Mark K. Shigenaga, Tory M. Hagen, and Bruce N. Ames* Division of Biochemistry and Molecular Biology, 401 Barker Hall, University of California, Berkeley, CA 94720 Contributed by Bruce N. Ames, July 27, 1994
H+ H+ H+ H+ H+ H+ H+ H+ H+ H+ H+ H+ H+ H+ H+ H+ H+ H+ H+ H+ H+ H+ H+ CITRIC ACID CYCLE Cellular Cytoplasm Mitochondrial Outer Membrane Intermembrane Space I CoQ Inner Membrane CytC III II V IV NADH Mitochondrial Matrix NAD+ FAD O2 FADH2 ADP H2O Succinate ATP Fumarate ATP Succinyl-Co-A -Ketoglutarate Dehydrogenase Complex NADH L-Malate NADH -Ketoglutarate Pyruvate Dehydrogenase complex NADH Oxaloacetate NADH Isocitrate Citrate Acetyl-Co-A Citrate Synthase 9
Mitochondria from old rats compared to those from young rats: 1) Lower Cardiolipin 2) Lower Membrane Potential 3) Lower Oxygen Utilization 4) Increased Oxidant Leakage
30 20 10 0 Cardiolipin Levels in 3 and 24 Month Old Rat Hepatocytes Cardiolipin (µg per 106 Cells) ** Young Old 10
R123 Fluorescence in old and young rat hepatocytes 0.03 Old 0.02 Young Normal cell number 0.01 0.00 10 100 1000 Fluorescence/cell 11
L-Carnitine/Acetyl-L-Carnitine (ALCAR) • Transports long-chain fatty acids into mitochondria • Removes short- and medium-chain fatty acids that accumulate • Mediates the ratio of acetyl-CoA/CoA • Decreases with age in plasma and in brain • Improves cognitive function in rats 12
30 20 Cardiolipin (µg per 10 cells) 10 0 Effect of ALCAR Supplementation on Cardiolipin Levels + ALCAR ** Old Young 14
R123 Fluorescence in Young and Old Rat Hepatocytes YOUNG NO ALCAR Normalized Cell Number WITH ALCAR OLD NO ALCAR WITH ALCAR Normalized Cell Number
R--Lipoic Acid (LA) in mitochondria • LA reduced to dihydrolipoic acid, a potent antioxidant, & chelator of Fe & Cu • Coenzyme of pyruvate and -ketoglutarate dehydrogenases • Involved with carbohydrate utilization for ATP production 15
Lipoic Acid Lowers Mitochondrial Oxidants in Old Rats ** 20 Fl. Units/O2 Consumed per Minute 10 + LA + LA 0 Young Old
MDA levels in young and old rats with LA, ALCAR, or both 80 P<0.05 ***p<0.001 vs. young rat group P<0.01 70 60 MDA (pmol/mg protein) *** Young Old 50 40 30 20 10 0 + LA + LA + ALCAR + ALCAR + LA + ALCAR + LA + ALCAR 20
800 * 600 + LA + ALCAR 400 200 + LA + ALCAR 0 Young Old Ambulatory Activity before and After Supplementation with Lipoic Acid (LA) + Acetyl-L-Carnitine (ALCAR) vs. young * vs. old # Distance Traveled (cm/hour/day) # *
Age-associated decrease in immune function and the effect of ALCAR (0.2%) + LA (0.1%) treatment for 2 months. Values are mean + SEM of 10-11 animals. P <0.001 3 0 p < 0 . 0 1 2 0 T cell stimulation index 1 0 0 Old Young Old Treated Young Treated
Morris Water Maze for Testing Spatial Memory Spatial Memory relies on intact hippocampal function. Treatments improved poor memory in old rats 22
Spatial Memory Tested With Morris Water Maze 100 P<0.001 P<0.05 80 60 Time in Seconds 40 + LA + ALCAR + ALCAR + LA 20 0 Young Old Old Old Old
Peak procedure: for measuring temporal memory. Associated with striatum, cerebellum, & hippocampus 0 50 100 150 200 0 50 100 150 200 14 PEAKRATE: measures learning and motivation. 12.00 Young 12 Old 10.00 Old + ALCAR PEAK TIME: measures internal clock, food is rewarded only when animals push lever 40s after sound or light signal Old + LA 10 Old + ALCAR + LA 8.00 8 6.00 6 4.00 4.00 2.00 2.00 0.00 0.00 SOUND: Time to Signal LIGHT: Time to Signal 25
Oxidative Damage to Nucleic Acid in Old Rats by mAb to oxo8G/oxo8dG: Immunohistochemical stain of neurons 26
Staining of oxidized nucleic acid in neurons (mAb to oxo8dG in DNA/oxo8G in RNA) RNA is Oxidized (92% is removed by RNase) *oxo8G: 8-hydroxyguanosine; oxo8dG: 8-hydroxy-2’-deoxyguanosine 27
Induction of Phase 2 Enzymes Induced 250 200 150 100 50 0 -50 231 Number of Genes 106 33 30 31 Repressed 7d (diet) 6h 24h Modulation of Nrf-2-dependent gene expression by D3T in mouse liver. Kwak, et al. J bio Chem, 2003
The Journal of Biological Chemistry Vol. 278, pp. 8135-8145, March 7, 2003 Modulation of Gene Expression by Cancer Chemopreventive Dithiolethiones through the Keap1-Nrf2 Pathway IDENTIFICATION OF NOVEL GENE CLUSTERS FOR CELL SURVIVAL Mi-Kyoung Kwak, Nobunao Wakabayashi, Ken Itoh, Hozumi Motohashi, Masayuki Yamamoto, and Thomas W. Kensler Proc. Natl. Acad. Sci. USA Vol. 101, pp. 3381-3386, March 9, 2004 Decline in transcriptional activity of Nrf2 causes age-related loss of glutathione synthesis, which is reversible with lipoic acid Jung H. Suh, Swapna V. Shenvi, Brian M. Dixon, Honglei Liu, Anil K. Jaiswal, Rui-Ming Liu, and Tory M. Hagen
1200 ** 150 # # 800 nmol/min/g 100 mM ** 400 50 # 0 0 Km for ALCAR Km for CoA 10 10 1/v 1/v 5 5 0 0 -10 0 10 20 30 40 -50 0 50 100 150 200 1/[ALCAR, mM] 1/[CoA, mM] young old * = vs. young # = vs. old # # * Vmax
New Yorker, June 6, 2005 “You’re fifty-seven years old. I’d like to get that down a bit.”
Meta-analysis of acetyl-L-carnitine versus placebo for mild cognitive impairment and mild Alzheimer’s disease Montgomery, S.A., Thal, L.J., and Amrein, R., Int. Clin. Psychopharmacol 18:61-71 (2003)
Treatment with alpha-lipoic acid significantly improves both neuropathic symptoms and deficits in diabetic patients with symptomatic diabetic neuropathy 90 80 a-lipoic acid 79 placebo 70 72 66 66 60 61 60 60 55 50 Percent 48 40 30 25 20 10 0 ALADIN I ALADIN III SYDNEY NATHAN II Meta-Analysis ITT analysis of 4 phase II-III RCTs plus meta-analysis: 600 mg I.v. per day for 3 weeks Total Symptom Score (TSS): relative improvement at 3 weeks vs baseline n= 77 81 338 165 60 60 241 236 716 542 * p<0.05 vs Placebo Source: Professor Daniel Ziegler of the Diabetes Research Institute, Düsseldorf, Germany: Meta-Analysis Provides Highest Level of Evidence, Diabetes Monitor (2002, p6)
Micronutrient Undernutrition in Americans Minerals Vitamins * USDA What we Eat in America (NHANES 2001-2002) Sept. 2005
Methionine Serine CH3-THF SHMT MS TS MTHFR B6 B12 CH2=THF dUMP Homocysteine dTMP (polymorphism)
Micronuclei in: RNA positive erythrocytes RNA negative erythrocytes 130 Folic Acid Folinic Acid 80 40 Micronuclei per 1000 cells 30 20 Normal range 0 50 100 150 200 250 300 350 1 year preRx TIME (DAYS)
60 50 40 MIN PCEs/1000 PCEs 30 20 x 10 x 0 0 5 10 15 20 25 30 PLASMA FOLATE (NG/ML)
Folate, Vitamin B12, Homocysteine Status and Chromosome Damage Rate in Lymphocytes of Older Men Michael Fenech, Ivor Dreostl, and Josephine Rinaldi, Carcinogenesis13:1329-1336, 1997 Folate, Vitamin B12, Homocysteine Status and DNA Damage in Young Australian Adults Michael Fenech, Claire Aitken, and Josephine Rinaldi, Carcinogenesis19:1163 - 1173, 1998 Micronucleus Frequency in Human Lymphocytes is Related to Plasma Vitamin B12 and Homocysteine Michael Fenech, Mutation Research42: 299 - 304, 1999 In a series of studies, we have been able to confirm that the micronucleus index in cytokinesis-blocked lymphocytes is significantly negatively correlated with plasma vitamin B12 (B12) concentration and significantly positively correlated with plasma homocysteine (HC). Furthermore we have shown in a randomized double-blind placebo-controlled dietary intervention study that intake of 3.5 times the RDI of folic acid and B12 significantly reduces the micronucleus index only in those with above average levels of micronucleus frequency. Micronucleus frequency is minimized when plasma HC is below 7.5 µmol/l and plasma B12 is above 300 pmol/l. Therefore, it is important to take account of the effect of B12 and HC when using the micronucleus assay for human biomonitoring studies.
Dose-response on micronuclei induction in cultured lymphocytes Acute exposure to X-rays vs. Folic Acid deficiency Fenech 2003, Nutrition Research Reviews
Randomized Double-blind placebo-controlled prospective trialwith 3.5X RDA folate and Vitamin B12 supplementation. Fenech et. al. 1998 Carcinogenesis.
3 2.5 Over all 2 DCF-PMNs 1.5 DCF-Lymph 1 Rh123-PMNs Z score 0.5 Rh123-Lymph 0 mtDNA damage -0.5 1/RCR -1 normal -1.5 -1.5 -1 -0.5 0 0.5 1 1.5 2 2.5 LN nonheme Fe (µmol/g wet liver) Analysis of nonlinear regression models: comparison of an overall model and individual models of Z-transformed values vs. ln- nonheme liver iron . Each of the six dependent variables (that were analyzed by nonlinear regression in former figures) were transformed to Z scores and modeled as a quadratic function of the ln-liver nonheme iron as the independent variable. The equation for the RCR ratio's Z score was obtained from inverted RCR values (1/RCR) so that normal rats had the lower instead of the higher values. For presentation purposes each model line was obtained from 9 values of liver iron. All statistics were performed as in materials and methods.
An overview of evidence for a causal relationship between iron deficiency during development and cognitive or behavioral function in children Joyce C McCann and Bruce N Ames (2007) AJCN in press
Is docosahexaenoic acid, an n3 long-chain polyunsaturated fatty acid, required for development of normal brain function? An overview of evidence from cognitive and behavioral tests in humans and animals Joyce C McCann and Bruce N Ames American Journal of Clinical Nutrition (2005) 82:281-95
Is there convincing biological or behavioral evidence linking Vitamin D deficiency to brain dysfunction? Joyce C McCann and Bruce N Ames Faseb J in press
Neurons Contain The Enzyme That Activates Vitamin D Eyles, DW et al (2005) J Chem Neuroanat 29, 21-30
Calcitriol Target Genes in the Brain McCann, JC, Ames BN (2007) Review Article: Is there convincing biological or behavioral evidence linking vitamin D deficiency to brain dysfunction? FASEB J, in press.
Zinc Deficiency Induces IncreasedOxidative Stress in C6 Glioma Cells * 140 120 100 Intensity (RFU) DCF Fluorescence 80 60 40 20 Control ZnAD ZnDF
Zinc Deficiency Induces Fapy Glycosylase (Fpg)-sensitive Single Strand Breaks in Human Lung Fibroblasts Control (+Fpg) ZnAD (+Fpg) ZnDF (+Fpg) * 200 160 120 Comet Score 80 40 0 Control ZnAD ZnDF
Heme-a Synthesis of Heme Cytosol PBG Porphyrins 2ALA ALA PPIX PPGIX FeII FC Mitochondria Heme Succ-CoA + Gly ALA PLP