Download
1 / 57
570 likes | 657 Views
Using the Sunyaev-Zel’dovich effect to probe the gas in clusters. Mark Birkinshaw University of Bristol. Outline. The origin of the effect SZ effect observations SZ effect science: clusters SZ effect science: cosmology The future: dedicated SZ instruments Summary.

E N D
Using the Sunyaev-Zel’dovich effect to probe the gas in clusters Mark Birkinshaw University of Bristol
Outline • The origin of the effect • SZ effect observations • SZ effect science: clusters • SZ effect science: cosmology • The future: dedicated SZ instruments • Summary Mark Birkinshaw, U. Bristol
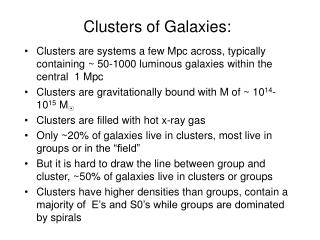
1. The origin of the effect Clusters of galaxies contain extensive hot atmospheres Te 6 keV np 103 protons m-3 L 1 Mpc 2 Mpc Mark Birkinshaw, U. Bristol
Inverse-Compton scatterings • Cluster atmospheres scatter photons passing through them. Central iC optical depth tenp sT L 10-2 • Scatterings changes the average photon frequency by a fraction kBTe/mec2 Mark Birkinshaw, U. Bristol
Microwave background spectrum Fractional intensity change I/I = -2 (n/n)te 10-4 I Mark Birkinshaw, U. Bristol
Thermal SZ effect • Fractional intensity change in the CMB I/I = -2 (n/n)te 10-4 • Effect in brightness temperature terms DTRJ = -2 Tr(n/n)te -300 K • Brightness temperature effect, DTRJ, is independent of redshift • Flux density effect,DS, decreases as DA-2, notDL-2, and depends on redshift Mark Birkinshaw, U. Bristol
Spectrum of thermal effect • spectrum related to gradient of CMB spectrum • zero at peak of CMB spectrum (about 220 GHz) • weak dependence on Te Mark Birkinshaw, U. Bristol
Predicted SZ effect sky SZ sky predicted using structure formation code (few deg2, y = 0 – 10-4) CMB primordial fluctuations ignored da Silva et al. Mark Birkinshaw, U. Bristol
SZ effect and CMB power spectrum Figure from Molnar & Birkinshaw 2000 thermal SZ kinematic SZ RS effect Mark Birkinshaw, U. Bristol
Attributes of SZ effect • TRJ is a redshift-independent function of cluster thermal energy, it is a calorimeter • TRJ has a strong association with rich clusters of galaxies, it is a mass finder • TRJ contains a weak redshift-independent kinematic effect, it is a radial speedometer • TRJ has polarization with potentially more uses, but signal is tiny Mark Birkinshaw, U. Bristol
2. SZ effect observations • Interferometers: e.g., Ryle, BIMA, OVRO • structural information • baseline range • Single-dish radiometers: e.g., OVRO 40-m, OCRA • speed • systematic errors from spillover • Bolometers: e.g., SuZIE, SCUBA, ACBAR • speed • structural and spectral information • weather Mark Birkinshaw, U. Bristol
Ryle telescope • first interferometric map • Abell 2218 • brightness agrees with single-dish data • limited angular dynamic range Figure from Jones et al. 1993 Mark Birkinshaw, U. Bristol
Interferometers • restricted angular dynamic range • high signal/noise (long integration possible) • clusters easily detectable to z 1 Figure from Carlstrom et al. 1999 Mark Birkinshaw, U. Bristol
Interferometers • restricted angular dynamic range set by baseline and antenna size • good rejection of confusing radio sources available baselines Abell 665 model, VLA observation Mark Birkinshaw, U. Bristol
Interferometers • Good sky and ground noise rejection because of phase data • Long integrations and high signal/noise possible • 10 years of data, tens of cluster maps • SZ detected for cluster redshifts from 0.02 (VSA) to 1.0 (BIMA) • Could be designed with better baseline range Mark Birkinshaw, U. Bristol
Single-dish radiometers • Potentially fast way to measure SZ effects of particular clusters • Multi-beams better than single beams at subtracting atmosphere, limit cluster choice • Less fashionable now than formerly: other techniques have improved faster • New opportunities: e.g., GBT Mark Birkinshaw, U. Bristol
Single-dish radiometers • fast at measuring integrated SZ effect of given cluster • multi-beam limits choice of cluster, but subtracts sky well • radio source worries • less used since early 1990s • new opportunities, e.g. GBT Figure from Birkinshaw 1999 Mark Birkinshaw, U. Bristol
Distribution of central SZ effects • Mixed sample of 37 clusters • OVRO 40-m data, 18.5 GHz • No radio source corrections • 40% of clusters have observable T < -100 K Mark Birkinshaw, U. Bristol
Bolometers • Should be fast way to survey for SZ effects • Wide frequency range possible on single telescope, allowing subtraction of primary CMB structures • Atmosphere a problem at every ground site • Several experiments continuing, SuZIE, MITO, ACBAR, BOLOCAM, etc. Mark Birkinshaw, U. Bristol
SCUBA 850 µm images: SZ effect measured in one; field too small Mark Birkinshaw, U. Bristol
MITO • MITO experiment at Testagrigia • 4-channel photometer: separate components • 17 arcmin FWHM • Coma cluster detection Figure from De Petris et al. 2002 Mark Birkinshaw, U. Bristol
Viper + ACBAR • Since 2001: 16-pixel bolometer (ACBAR); 150, 220, 280 GHz (+350 GHz in 2001) • Dry air, 3º chopping tertiary, large ground shield • 4 – 5 arcmin FWHM • Excellent for SZ work Mark Birkinshaw, U. Bristol
ACBAR cluster observations 2002 cluster observations: three of nine objects detected? Mark Birkinshaw, U. Bristol
SZ effect status • About 100 cluster detections • high significance (> 10) measurements • multi-telescope confirmations • interferometer maps, structures usually from X-rays • Spectral measurements improving but still rudimentary • no kinematic effect detections • Preliminary blind and semi-blind surveys Mark Birkinshaw, U. Bristol
3. SZ effect science: clusters • Integrated SZ effects • total thermal energy content • total hot electron content • SZ structures • not as sensitive as X-ray data • need for gas temperature • Mass structures and relationship to lensing • Radial peculiar velocity via kinematic effect Mark Birkinshaw, U. Bristol
Integrated SZ effects • Total SZ flux density Thermal energy content immediately measured in redshift-independent way Virial theorem then suggests SZ flux density is direct measure of gravitational potential energy Mark Birkinshaw, U. Bristol
Integrated SZ effects • Total SZ flux density If have X-ray temperature, then SZ flux density measures electron count, Ne (and hence baryon count) Combine with X-ray derived mass to get fb Mark Birkinshaw, U. Bristol
SZ effect structures • Currently only crudely measured by SZ methods (restricted angular dynamic range) • X-ray based structures superior • Structure more extended in SZ than X-ray: nerather than ne2dependence. SZ should show more about outer gas envelope, but need better sensitivity Mark Birkinshaw, U. Bristol
SZ effects and lensing Weak lensing measures ellipticity field e, and so Surface mass density as a function of position can be combined with SZ effect map to give a map of fb SRJ/ Mark Birkinshaw, U. Bristol
Total and gas masses Inside 250 kpc: XMM +SZ Mtot = (2.0 0.1)1014 M Lensing Mtot = (2.7 0.9)1014 M XMM+SZ Mgas = (2.6 0.2) 1013 M CL 0016+16 with XMM Worrall & Birkinshaw 2002 Mark Birkinshaw, U. Bristol
Cluster radial peculiar velocity • Kinematic effect separable from thermal SZ effect because of different spectrum • Confusion with primary CMB fluctuations limits velocity accuracy to about 150 km s-1 • Velocity substructure in atmospheres will reduce accuracy further • Statistical measure of velocity distribution of clusters as a function of redshift in samples Mark Birkinshaw, U. Bristol
Cluster radial peculiar velocity Need • good SZ spectrum • X-ray temperature Confused by CMB structure Sample vz2 Three clusters so far, vz 1000 km s A 2163; figure from LaRoque et al. 2002. Mark Birkinshaw, U. Bristol
4. SZ effect science: cosmology • Cosmological parameters • cluster-based Hubble diagram • cluster counts as function of redshift • Cluster evolution physics • evolution of cluster atmospheres via cluster counts • evolution of radial velocity distribution • evolution of baryon fraction • Microwave background temperature elsewhere in Universe Mark Birkinshaw, U. Bristol
Cluster Hubble diagram X-ray surface brightness X ne2 Te½ L SZ effect intensity change I ne Te L Eliminate unknown ne • L I2 X1 Te3/2 H0 XI2 Te3/2 Mark Birkinshaw, U. Bristol
Cluster distances and masses CL 0016+16 DA = 1.36 0.15 Gpc H0 = 68 8 18 km s-1 Mpc-1 Worrall & Birkinshaw 2002 Mark Birkinshaw, U. Bristol
Hubble diagram • poor leverage for other parameters • need many clusters at z > 0.5 • need reduced random errors • ad hoc sample • systematic errors From Carlstrom, Holder & Reese 2002 Mark Birkinshaw, U. Bristol
Critical assumptions • spherical cluster (or randomly-oriented sample) • knowledge of density and temperature structure to get form factors • clumping negligible • selection effects understood need orientation-independent sample Mark Birkinshaw, U. Bristol
Blind surveys • SZ-selected samples • almost mass limited and orientation independent • Large area surveys • 1-D interferometer surveys slow, 2-D arrays better • radiometer arrays fast, but radio source issues • bolometer arrays fast, good for multi-band work • Survey in regions of existing surveys • XMM-LSS survey region ideal, many deg2 Mark Birkinshaw, U. Bristol
Cluster counts and cosmology dN/dz Cluster counts and redshift distribution provide strong constraints on 8, m, and cluster heating. Wm=1.0 WL=0 s8=0.52 Wm=0.3 WL=0.7 s8=0.93 Wm=0.3 WL=0 s8=0.87 z Figure from Fan & Chiueh 2000 Mark Birkinshaw, U. Bristol
ACBAR blind survey CMB5 field, filtered, pointing source blanked. Features at s/n > 4. Mark Birkinshaw, U. Bristol
Baryon mass fraction SRJ Ne Te Total SZ flux total electron count total baryon content. Compare with total mass (from X-ray or gravitational lensing) baryon fraction b/m Figure from Carlstrom et al. 1999. Mark Birkinshaw, U. Bristol
Microwave background temperature • Ratio of SZ effects at two different frequencies is a function of CMB temperature (with slight dependence on Te and cluster velocity) • So can use SZ effect spectrum to measure CMB temperature at distant locations and over range of redshifts • Test T (1 + z) Mark Birkinshaw, U. Bristol
Microwave background temperature • Test T (1 + z) • SZ results for two clusters plus results from molecular excitation Battistelli et al. (2002) Mark Birkinshaw, U. Bristol
5. The future: dedicated SZ instruments Mark Birkinshaw, U. Bristol
Survey speeds • OCRA will be fastest survey radiometer • AMiBA will be fastest survey interferometer • Frequencies complementary Mark Birkinshaw, U. Bristol
New SZ interferometers AMIBA 90 GHz SZA 30 GHz AMI 15 GHz Complementary spectral coverage Short baselines crucial for SZ detection Long baselines for radio sources AMiBA SZA AMI solid nearby high-M cluster dashed high-z low-M cluster Mark Birkinshaw, U. Bristol
AMiBA • ASIAA/NTU project • Operational in 2004, prototype 2002 • 19(?) dishes, 1.2/0.3 m diameters, 1.2 – 6 m baselines • = 95 GHz, = 20 GHz • Dual polarization • 1.3 mJy/beam in 1 hr Mark Birkinshaw, U. Bristol
XMM-LSS survey SZ follow-up • XMM survey of 64 deg2 to 5 10-15 erg cm-2 s-1 (0.5 – 2.0 keV) • Expect 300 sources deg-2, 12% clusters 2000 clusters • SZ imaging will give Hubble diagram to z = 1 • Combining X-ray, SZ, shear mapping at z < 0.5 will give baryon fraction and total masses • possible SZ detection of IGM filaments? Mark Birkinshaw, U. Bristol
Cluster finding: X-ray vs SZ • AMiBA is better than XMM for clusters at z > 0.7 • interferometers provide almost mass limited catalogues • may find X-ray dark clusters LX(5) z Mark Birkinshaw, U. Bristol
OCRA Torun Observatory, Jodrell Bank, Bristol, Bologna OCRA-p Mark Birkinshaw, U. Bristol