Download
1 / 29
290 likes | 414 Views
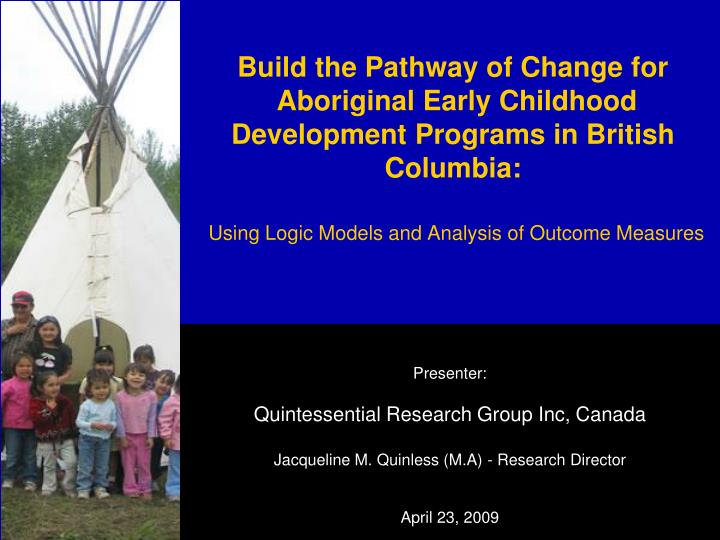
Presenter: Quintessential Research Group Inc, Canada Jacqueline M. Quinless (M.A) - Research Director April 23, 2009. Build the Pathway of Change for Aboriginal Early Childhood Development Programs in British Columbia: Using Logic Models and Analysis of Outcome Measures. Overview.

E N D
Presenter: Quintessential Research Group Inc, Canada Jacqueline M. Quinless (M.A) - Research Director April 23, 2009 Build the Pathway of Change for Aboriginal Early Childhood Development Programs in British Columbia:Using Logic Models and Analysis of Outcome Measures
Overview • Aboriginal Population Profile 2006 • Project Background • Participatory Methodology Results • Pathway Design Model & Program Evaluation • Outcome Measures • Aboriginal Head Start: Campbell River • National Aboriginal Data Sources • Policy Implications • Next Steps
Defining the Aboriginal Population in Canada • Concepts to count Aboriginal people are multidimensional: • Origin or Ancestry • Identity • Registered Indian Status • First Nation/Band membership
Aboriginal Population Profile 2006 • The number of people who identified as Aboriginal (North American Indian/First Nations, Métis and/or Inuit) surpassed the one-million mark, reaching 1,172,790. • This accounts for almost 4% of the total Population of Canada, up from 3.3% in 2001 and 2.8% in 1996. • The Aboriginal population in Canada is growing extremely fast. According to Statistics Canada from the period between 1996 and 2006 the Aboriginal population in Canada grew by 45%, which is the nearly six times faster than the 8% rate increase for the non-Aboriginal population • Of the three Aboriginal groups in Canada, the Métis experienced the greatest increase in the past decade. Their number grew 91%, reaching 389,785 people in 2006. This was more than three times as fast as the 29% increase in First Nations people, whose number reached 698,025. The Inuit increased 26%, to 50,485
Perhaps foremost, children are seen in diverse Aboriginal traditions as gifts from the Creator; they are cared for as the purpose of life. Care, education, is not bounded by schools or by mind-body-spirit fragmentations or by stages of life. From before birth until after death children are a sacred legacy on loan to parents by the Creator (Stairs et. al. 2002: 323). ABORIGINAL CHILDREN
Aboriginal Children Profile 2006 • According to the 2006 Census, there were approximately 7,000 Inuit, 35,000 Métis and 47,000 off-reserve First Nations children under the age of six across Canada • Nearly half (49%) of off-reserve First Nations children under age 6 were in low-income families, compared with 18% of non-Aboriginal children. Dissatisfaction with housing was over twice as high for those living in low-income families than for those not in low-income families (22% versus 9%). • The Aboriginal population is younger than the non-Aboriginal population. Almost half (48%) of the Aboriginal population consists of children and youth aged 24 and under, compared with 31% of the non-Aboriginal population. • About 9% of the Aboriginal population was aged 4 and under, nearly twice the proportion of 5% of the non-Aboriginal population • .
Aboriginal Children Profile 2006 • Compared to non-Aboriginal children, higher percentages of young Aboriginal children are growing up in large families and with young parents. Among Aboriginal children under six years old had mothers between the ages of 15 to 24 compared to 8% of non-Aboriginal children • A signifcantly larger proportion of Canadian Aboriginal children aged 14 and under lived with a lone mother (29%) compared to their non-Aboriginal counterparts (14%). • More Aboriginal children aged 14 and under lived with a lone father (6%) compared to the non-Aboriginal population (3%).
The Aboriginal Population: British Columbia • The 2006 Census enumerated 196,075 Aboriginal people in BC, accounting for 5% of the total population in the province • The Aboriginal population in BC grew by 15% between 2001 and 2006, more than three times the rate of the non-Aboriginal population, and by 39% between 1996 and 2006 • More Aboriginal people are now living in off-reserve urban centers. In 2006, 60% of the Aboriginal population in BC lived in urban areas while 26% lived on reserves • The majority of Aboriginal children aged 14 and under (58%) lived with both parents in BC, while 28% lived with a lone mother and 6% with a lone father. In contrast, 13% of non-Aboriginal children in BC lived with a lone mother, and 3% with a lone father.
General Characteristics 2006 • Largest young and growing population • Most disadvantaged of all Canadians in terms of income, employment, housing, nutrition, and health • Life chances are less (ten years less than others) • Highest infant mortality rate and disease rate • Limited educational opportunities • In the spring of 2006, the provincial government enacted the New Relationship Trust Act, which provides funds for First Nations in BC to acquire tools, training, and skills to better participate in land and resource management planning, and develop social, economic and cultural programs for their communities
Project Background Vision … • Build a common & coordinated provincial program evaluation system for Aboriginal Early Child Developments (AECD) Programs • Culturally-relevant & honors community-specific needs • Flexible enough to handle the diversity of program content • Need a solid understanding of how agencies & organizations are evaluating their AECD programs • Capacity-building focus • Two evaluation assessments
Project Background Current Picture … • The use of program logic models are growing—9 out of 43 agencies were using this tool to visually map out how their service deliverables were impacting outcomes among their target group. • Agencies using logic models seem to be better equipped at conducting program evaluations and are able to apply evaluation strategies that are more meaningful to them. • A provincial logic model framework is a sensible precursor to a provincial evaluation system—a common approach to modeling program information will help identify & build upon evaluation systems already in place.
Intermediate Outcomes Long-Term Outcomes Outputs Short-Term Outcomes Goals Inputs Activities Project Background • Current Picture (continued) ... • While logic models take many different forms, the standard approach to logic modeling tends to resemble the linear format pictured below. • Logic models can serve as powerful tools for consensus building, communicating, advocating, planning & evaluating. • BUT, they do pose some challenges …
Project Background Current Challenges … • The complex terminology can make program planning and evaluation more cumbersome & confusing. • Terms describing the elements of a logic model tend to mean different things to people, agencies and regions. • The structure compartmentalizes rather than teases out the story of what is happening as a result of the program. • The approach tends to be not user-friendly or holistic.
Pathway Design Redesigning the Framework … • The goal was to redesign a logic model framework that visually groups and links program elements in a consistent and easy-to-understand way. • The idea of a cyclical pathway emulating a Medicine Wheel emerged from years of conducting program evaluations & dialogues with key stakeholders—University of Victoria, Aboriginal Head Start Association of BC, BC Stats and the BC Ministry of Children & Family Development. • The framework was refined after consulting 10 different Aboriginal agencies across BC. Participants included child educators, team leaders, managers, executive directors, regional advisors, consultants and outreach workers.
The Pathway of Change: A CulturallyRelevant Approach OUTPUTS “Everything on the earth has a purpose, every disease an herb to cure it, and every person a mission,” Mourning Dove (Chistine Quintasket), Salish.
Performance measurement Outcome Assessments Outcome Measures Monitoring Indicators Accountability and Effectiveness
Outcome Measures • What is the point of outcome measures? • Achieving program objectives, community goals • Accountability and funding • Providing a tool for advocacy and negotiation • Improving the quality of life and life chances of Aboriginal families and children • Using outcomes measures exclusively on their own can be limiting…
National Benchmarks • Currently the Aboriginal Head Start Association of BC uses Pathway Model framework in strategic planning • Outcomes can be benchmarked with aggregated national and provincial datasets for performance measurement and program/service delivery enhancement • Examples of National Data Sources: • 2006 Aboriginal Peoples Survey • 2006 Census of Population • 2006 Aboriginal Children’s Survey
Aboriginal Head Start Association of BC • One of six Key Components: • The purpose of the Culture and Language component is to provide children with a positive sense of themselves as Aboriginal children • to build on the children's knowledge of their Aboriginal languages and experience of culture in their communities. • A desire for life long learning, and opportunities to develop fully as successful young people Why learn a traditional language? • Research has shown that the worldview of a people is rooted in their language --language and culture are intertwined. Language revitalization is associated with cultural preservation How is the initiative working at a local level?
AHSABC: Campbell River Qwallayuw Aboriginal Head Start Center: Campbell River • The name for the centre is Qwallayuw, (Gwal’you) means "my reason for living”. • The center has two Elders who are knowledgeable about native dancing, and teach the children in oral tradition. There are several teachers and parents involved in the program • There are two sessions everyday from 9:00 -11:30 and from 12:30 to 2:30. • Group activities include circle, science, art, culture, cooking, gym, playground, walk, computers, or literacy with the Kindergarten Teacher.
GUIDING VISION Children have a positive sense of themselves as Aboriginal children? Building the Pathway of Change: Campbell River OUTCOME INDICATORS & MEASURES Through performance at graduation ceremony and teacher assessments, children have learned 20 new Kwakwala words, 3 new dances and 4 songs, 2 stories in oral tradition and learn about clans. OUTPUTS • every afternoon day from 9:00 to 11:30 and 12:30 to 2:30 • 49 off reserve children ages 3 to 5 years • K’wakwala • 9 males and 11 females in each class DESIRED OUTCOMES First Nation Children have increased knowledge of Aboriginal languages and cultural teachings Stakeholders KEY STRATEGIES An afternoon program with the following group activities: circle, art, culture, cooking, computers, or literacy. Classes also teach children many dances and involvement in clans, such as wolf, eagle, raven, and bear. INPUTS Teacher, 2 elders, 5 parents, musical instruments and funding for resources (e.g., 2 computers and small library).
2006 Profile of Aboriginal Children, Youth, and Adults • This interactive online tool is available at www.statcan.ca and provides an extensive set of data about Aboriginal children, youth and adults (Métis, Inuit and off-reserve North American Indians) using key indicators from the Aboriginal Peoples Survey (2006) and Aboriginal Children’s Survey (2006) • Data are presented using the concepts of Aboriginal identity, Treaty Indian or Registered Indian status (as defined by the Indian Act of Canada) and Aboriginal ancestry.
Example: Using National Data for Benchmarking Source: Statistics Canada, Aboriginal Children’s Survey 2006, Community Profiles
Policy Implications • The pathway to change logic model and outcome measures helps to describe and assess the various components of the Aboriginal Head Start program (provincially and nationally) • Knowledge of language is one of the values that many Aboriginal communities and families want to teach their children and is a way to maintain cultural strength • It contributes to the body of knowledge that can inform researchers about early childhood programs supported by local Aboriginal organizations • This methodology and interactive tool has applications for local and regional evaluations and can be used to generate outcomes compatible with National program/policy objectives
Next Steps… • In the next few months, the following will be distributed to Aboriginal Head Start Sites in BC: • Pathway of Change Do-it-Yourself Workbook contains step-by-step instructions on how to build the pathway of change (including glossary, tips, definitions and instructions) • An interactive tool that can help people electronically build (i.e., record, store & report) their program’s pathway of change. • Future ideas include converting the electronic tool into an online web-based program and expanding on pathway reporting options (e.g., converting open-ended text into checklist categories). • Continued use of national datasets and more sophisticated quantitative analysis that links outcomes for enhanced program planning and benchmarking purposes