Download
1 / 14
140 likes | 281 Views
Global Population Change (Lesson 4). Just for fun!. Think back to your predictions of the population in lesson 1, which should still be in your files. What do you think the population of the world is now? The population is . Learning Objectives.

E N D
Just for fun!... Think back to your predictions of the population in lesson 1, which should still be in your files. What do you think the population of the world is now? The population is ...
Learning Objectives • To act as ‘demographers’ and define the ‘vital rates’ • To compare countries at different stages of development • To explain the changes in the UK’s population since 1700
What is ‘demography’? And what does it mean to be a ‘demographer’? • The ‘vital rates’ are extremely important in studying demography, as they are the main factors that contribute to population change. • Let’s try to remember what they are using your mini-whiteboards: • Birth rate • Death rate • Fertility rate • Infant Mortality rate • Life Expectancy • Migration rate • Population Density • Changes over time
Look at page 158 in the AS Geography textbooks. Complete the following table using the information from table 5.2 in the book:
Which statistics is it ‘good’, ‘bad’ or ‘neither’ to be top of the lists for? Look at the countries that do well across all statistics. Do any patterns emerge? Look at the countries that do badly across all statistics. Do any patterns emerge here? The tables in the books and the ones you have completed both offer important data when looking at how population and the vital rates differ between different countries at different stages of development. However, what part of important information does the table in your books miss out? Clue: It’s one of the vital rates.
Changes in the UK’s birth and death rates from 1700-2006 Look at the graph you’ve been given. It shows how Britain’s birth and death rates have changed over the past 300 or so years. Try to come up with some reasons to help to explain the changes in the population by annotating the graph. For example: The death rate was higher in 1915 and 1945 because of World War 1 and World War 2.
Changes in Britain’s Birth and Death Rates 1700-2006 40 Rate per 1000 inhabitants 30 20 10
Where would the following events fit on to the graph? Remember to give reasons for your decisions.
Changes in Britain’s Birth and Death Rates 1700-2006 40 Rate per 1000 inhabitants 30 20 10
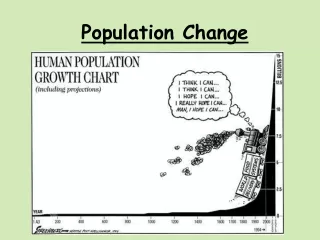
Plenary Think ahead and try to come up with a theory of your own as to what you think will happen to the global population in the coming decades. Remember to give reasons and explanations for your answers.