Download
1 / 14
140 likes | 255 Views
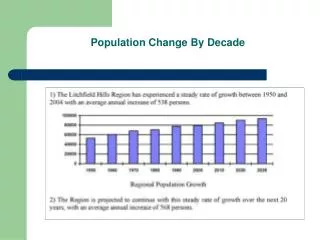
Global Population Change (Lesson 1). Learning Objectives. To describe global population growth To interpret and use a graph To evaluate the reliability of sources. Starter: The Global Population. Have a guess at what the population for the whole planet is. Your guess has to be exact!

E N D
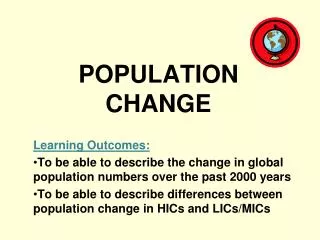
Learning Objectives • To describe global population growth • To interpret and use a graph • To evaluate the reliability of sources
Starter: The Global Population Have a guess at what the population for the whole planet is. Your guess has to be exact! Now let’s see how close you were: http://www.poodwaddle.com/worldclock.swf As you can see, the world’s population is rising quite dramatically. Why do you think this is? Now predict what the population of the planet will be at the end of this lesson, in about 45minutes time.
Population • The number of people living in a place. Usually measured using a census. • People who study population are called Demographers
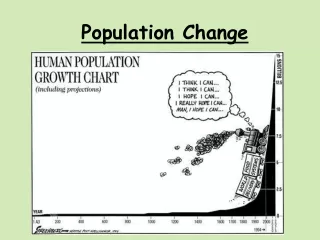
Some key terms... Population explosion Where the population increases at a rapid rate, more alarmingly than in previous years. Exponential Growth World population seems to following exponential growth rates Also known as geometric growth. Population is doubling at each stage e.g. 1,2,4,8,16,32 etc. This is in contrast to arithmetic growth where something grows by the same thing each time e.g. 1,2,3,4,5 etc
Semi-logarithmic graph showing World and continental populations Semi-logarithmic graphs have a log scale on the y axis but a normal scale on the x axis – each cycle shows an increase by a factor of 10. Semi-log graphs are used for presenting and interpreting data showing change over time. Useful when a value is increasing at a constant rate. A straight line on a semi log graph shows steady growth. Here population data can fit onto a graph – if a normal graph had been used then the scale on the y axis would have to go from 180 million to 9 billion and have been difficult to read. http://www.youtube.com/watch?v=umFnrvcS6AQ From 10.28 until 17.50 mins
Put these 2 sources of population data side by side. • Which continent is responsible for the greatest population growth? • Which continent has the fastest rate of population growth?
Looking at the previous graph... • ... describe the general pattern as shown by the graph. • ... how long did it take the population to increase from: • 3 billion to 4 billion? • 4 billion to 5 billion? • 5 billion to 6 billion? • ... according to the prediction, how long will it take to increase from: • 6 billion to 7 billion? • 7 billion to 8 billion? • 8 billion to 9 billion? • ... how long did it take to double from 3 billion to 6 billion? • ... predict how long it will take to double again to 12 billion. • What has happened to the rate of growth, and what will happen, and more importantly, why? What might happen to upset your predictions?
Evaluate the sources: What does evaluate mean? What do you do? When presented with resources like this, you should: - find out who produced it and why - look at its accuracy and reliability - How useful is this source?
Another key term... ... Sustainable development meeting the needs of the present population without compromising or negatively affecting the needs of future populations. Remember... ...what was happening to the world’s population? And what was happening to the amount of productive land left in the world? Therefore, is this rate sustainable?
How close were your predictions? The Population is ...