Download
1 / 19
230 likes | 628 Views
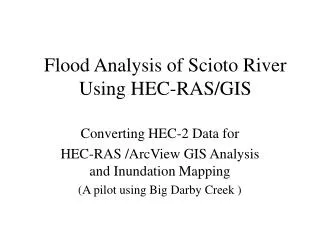
Cost Path Analysis of Skid Trails Using GIS. Laura Heath December 14, 2006 FOR 557. Outline. Purpose Location Analysis Approach and Obstacles Results. Purpose. Cost Distance Analysis

E N D
Cost Path Analysis of Skid Trails Using GIS Laura Heath December 14, 2006 FOR 557
Outline • Purpose • Location • Analysis Approach and Obstacles • Results
Purpose • Cost Distance Analysis • Raster analysis that calculates the cost of traveling from one cell to the next based on assumptions specified by the user. • Goal: • Determine least cost paths for skid trails in logging operations.
Best Management Practices • Limit the crossing of streams • No cutting within a 50 ft. buffer around streams and bodies of water • Skid trail distances from water: • 50 ft with slope <10% • 100 ft with slope >10% and <30% • 150 ft with slope > 30% • Landings should be flat and well-drained • Use existing roads/trails as much as possible
Approach • Obtain necessary information: • Roads • Tax parcels • DEMs • Hydrography • Edit data to match with orthophotos VectorData Raster Data VectorData Raster Data Cost Surface Cost Distance Cost Path Vector Data Raster Data
Location Sexsmith Lake in Davenport, NY Delaware County
Step 1: Find location of landing • Slope ≤ 3% • Within 100 meters of road • Intersecting the road • Not within 50 meters of a body of water • Located within the harvest stands
Step 2: Erase Hydrography Buffers from Harvest Stands Step 3: Convert DEM to Percent Slope Classes blue: >30% pink: 10-30% purple: 5-10% green: <5%
Step 5: Convert to Raster • Spatial Analyst Toolbar → Convert → Features to Raster • Slope (%) • Concentric polygons (distance from edge) • Roads (ID of 1)
Step 6: Reclassify • Change values of cells to reflect cost of travel • Concentric polygons: • -300 → 1 • -250 → 2 • -200 → 3 • -150 → 4 • -100 → 5 • -50 → 6 • NoData → 7 • Slope: • 0-5% → 1 • 5-10% → 2 • 10-30 → 5 • >30% → 10 • Road: • ID 1 → 1 • NoData → 50
Step 7: Overlay Rasters to Create the Cost Surface • GIS Help says to use Weighted Overlay Tool • I used the Raster Calculator in Spatial Analyst [concentric polygon] + [slope] + [roads]
Step 8: Create Cost Distance Raster • The cost raster was created using the cost distance tool
Step 9: Cost Path • Calculates most efficient pathway given a destination, cost distance raster and cost backlink raster.