Download
1 / 2
20 likes | 29 Views
Allow me to quote John Murphy’s recent message from his <br>blog on www.stockcharts.com” “Most corrections occur during the late summer/ early autumn period. The two weakest months of the year are usually August and September. October often starts off weak and ends up strong, which makes it a tricky month.

E N D
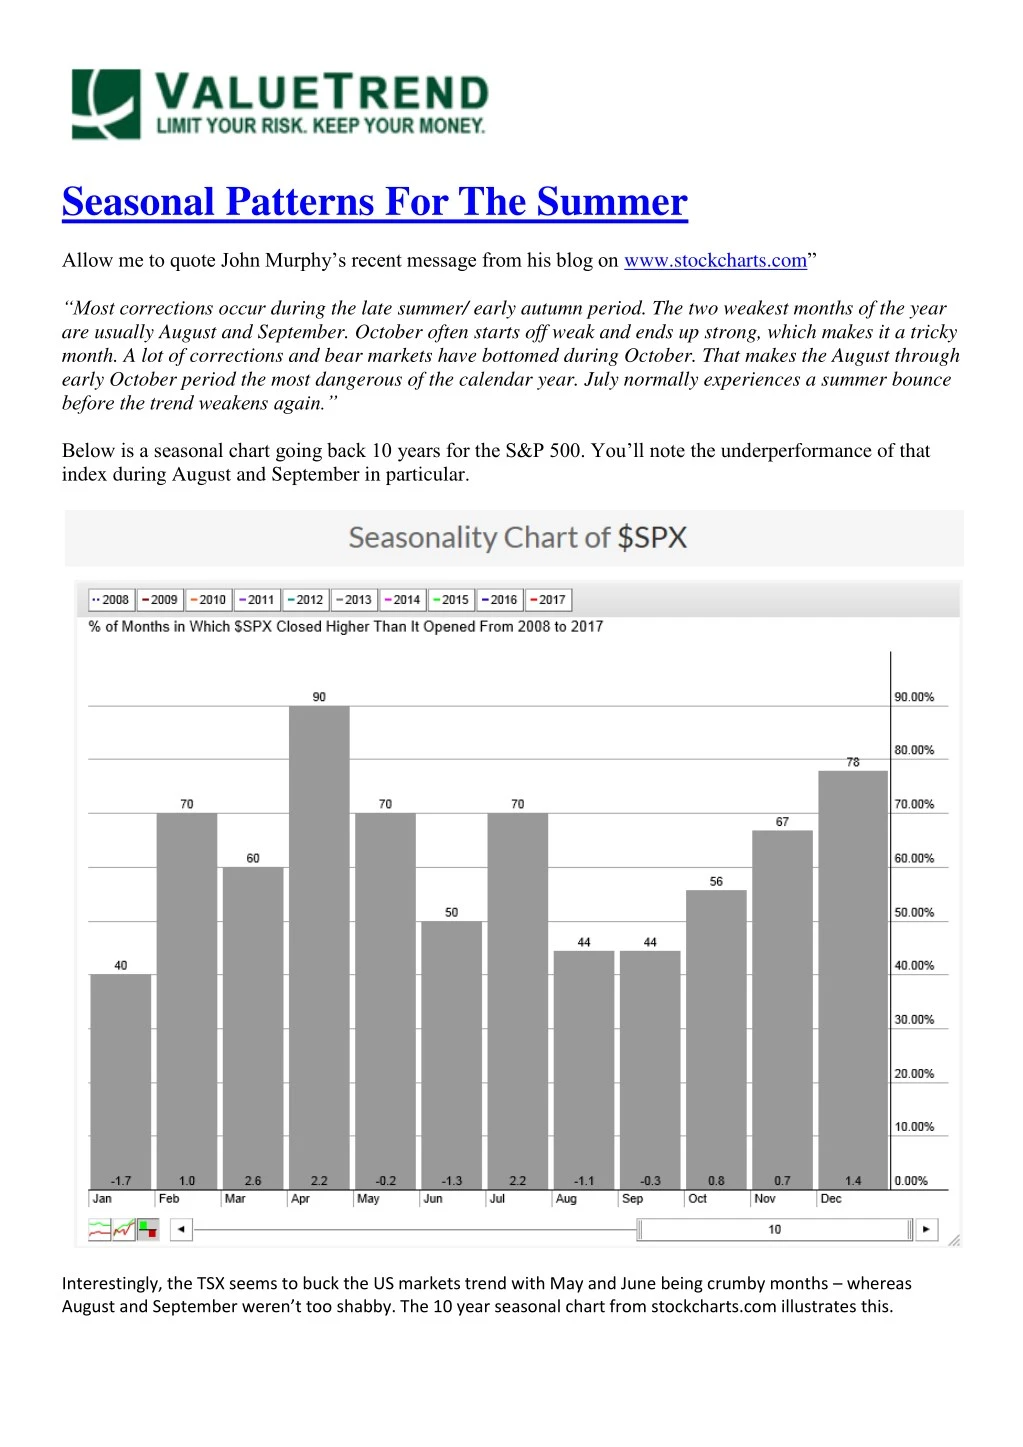
Seasonal Patterns For The Summer Allow me to quote John Murphy’s recent message from his blog on www.stockcharts.com” “Most corrections occur during the late summer/ early autumn period. The two weakest months of the year are usually August and September. October often starts off weak and ends up strong, which makes it a tricky month. A lot of corrections and bear markets have bottomed during October. That makes the August through early October period the most dangerous of the calendar year. July normally experiences a summer bounce before the trend weakens again.” Below is a seasonal chart going back 10 years for the S&P 500. You’ll note the underperformance of that index during August and September in particular. Interestingly, the TSX seems to buck the US markets trend with May and June being crumby months – whereas August and September weren’t too shabby. The 10 year seasonal chart from stockcharts.com illustrates this.
Explanations for that phenomenon might be due to the start of the positive seasonal patterns on some of our key commodities. Seasonally there is a major positive seasonal pattern for gold—and minor positive patters for silver, copper, crude oil. Further, you sometimes see the Canadian banks begin to move a bit better from late summer and on- I’ve discussed the technical pattern on this blog. Keep an eye open for any weakness in the next couple of months –it may create opportunities. Read more - http://www.valuetrend.ca/seasonal-patterns-summer/