Download
1 / 13
130 likes | 233 Views
3 x – y < 5. 3 x – y < 5. 3( 1 ) – 5 5. 3( 6 ) – ( –2 ) 5. 20 < 5. FALSE. –2 < 5. TRUE. Graphs of Linear Inequalities.

E N D
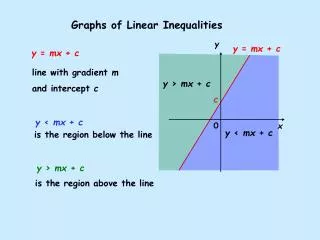
3x – y < 5 3x – y < 5 3(1)–5 5 3(6) – (–2) 5 20 < 5 FALSE –2 < 5 TRUE Graphs of Linear Inequalities When the equal sign in a linear equation is replaced with an inequality sign, a linear inequality is formed. Solutions of linear inequalities are ordered pairs. Example Determine whether (1, 5) and (6, –2) are solutions of the inequality 3x – y < 5. Solution The pair (1, 5) is a solution of the inequality, but (6, –2) is not.
3x – y < 5 3x – y < 5 3(1)–5 5 3(6) – (–2) 5 20 < 5 FALSE –2 < 5 TRUE Example Determine whether (1, 5) and (6, –2) are solutions of the inequality 3x – y < 5. Solution The pair (1, 5) is a solution of the inequality, but (6, –2) is not.
Graph Example Solution First: Graph the boundary y = x. Since the inequality is greater than or equal to, the line is drawn solid and is part of the graph of (0, 1) The graph of a linear equation is a straight line. The graph of a linear inequality is a half-plane, with a boundary that is a straight line. To find the equation of the boundary line, we simply replace the inequality sign with an equals sign. y 6 y = x 5 4 3 2 1 -5 -4 -3 -2 -1 1 2 3 4 5 x -1 -2 -3 -4 -5 Second: We choose a test point on one side of the boundary, say (0, 1). Substituting into the inequality we get We finish drawing the solution set by shading the half-plane that includes (0, 1).
Examples Graph the following inequalities.
Systems of Linear Inequalities To graph a system of equations, we graph the individual equations and then find the intersection of the individual graphs. We do the same thing for a system of inequalities, that is, we graph each inequality and find the intersection of the individual graphs.
The graph of the system Example
Type Example Solution Linear inequalities –3x + 5 > 2 A set of numbers; in one variable an interval Type Example Solution Linear equations 2x – 8 = 3(x + 5) A number in one variable Graph Graph Let’s look at 6 different types of problems that we have solved, along with illustrations of each type.
Type Example Solution Linear equations 2x + y = 7 A set of ordered in two variables pairs; a line Graph
Type Example Solution Linear inequalities x + y≥ 4 A set of ordered in two variables pairs; a half-plane Graph
Type Example Solution System of x + y= 3, An ordered pair or equations in 5x – y = –27 a (possibly empty) two variables set of ordered pairs Graph
Type Example Solution System of 6x – 2y ≤ 12, A set of ordered inequalities in y – 3 ≤ 0, pairs; a region two variables y ≥ x of a plane Graph