Download
1 / 30
310 likes | 404 Views
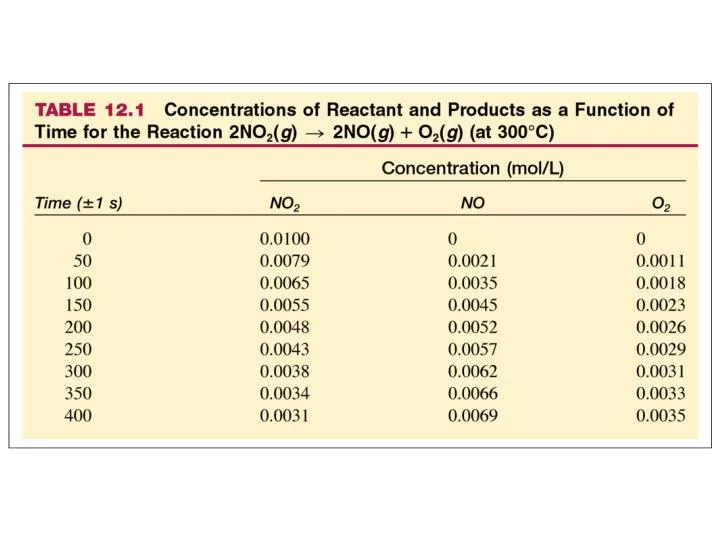
Figure 12.1: Starting with a flask of nitrogen dioxide at 300°C, the concentrations of nitrogen dioxide, nitric oxide, and oxygen are plotted versus time.

E N D
Figure 12.1: Starting with a flask of nitrogen dioxide at 300°C, the concentrations of nitrogen dioxide, nitric oxide, and oxygen are plotted versus time.
Figure 12.2: Representation of the reaction 2NO2(g) 2NO(g) + O2(g). (a) The reaction at the very beginning (t 5 0). (b) and (c) As time passes, NO2 is converted to NO and O2.
Figure 12.3: A plot of the concentration of N2O5 as a function of time for the reaction 2N2O5(soln) 4NO2(soln) 1 O2(g) (at 45ºC). Note that the reaction rate at [N2O5] = 0.90 M is twice that at [N2O5] = 0.45 M.
Figure 12.5: A plot of [N2O5] versus time for the decomposition reaction of N2O5.
Figure 12.6: (a) A plot of ln[C4H6] versus t. (b) A plot of 1/[C4H6] versus t.
Figure 12.7: A plot of [A] versus t for a zero-order reaction.
Figure 12.9: A molecular representation of the elementary steps in the reaction of NO2 and CO.
Figure 12.10: A plot showing the exponential dependence of the rate constant on absolute temperature.
Figure 12.11: (a) The change in potential energy as a function of reaction progress for the reaction 2BrNO 2NO + Br2. The activation energy Ea represents the energy needed to disrupt the BrNO molecules so that they can form products. The quantity DE represents the net change in energy in going from reactant to products. (b) A molecular representation of the reaction.
Figure 12.12: Plot showing the number of collisions with a particular energy at T1 and T2, where T2 > T1.
Figure 12.13: Several possible orientations for a collision between two BrNO molecules. Orientations (a) and (b) can lead to a reaction, but orientation (c) cannot.
Figure 12.14: Plot of ln(k) versus 1/T for the reaction 2N2O5(g) 4NO2(g) + O2(g). The value of the activation energy for this reaction can be obtained from the slope of the line, which equals -Ea/R.
Figure 12.15: Energy plots for a catalyzed and an uncatalyzed pathway for a given reaction.
Figure 12.16: Effect of a catalyst on the number of reaction-producing collisions.
Figure 12.17: Heterogeneous catalysis of the hydrogenation of ethylene.
Figure 12.19: The removal of the end amino acid from a protein by reaction with a molecule of water. The products are an amino acid and a new, smaller protein.