Download
1 / 21
220 likes | 363 Views
Soil and Sediment Toxicity. Getting’ Down ‘n Dirty. Introduction. Nobody cared much about soil at the beginning of the environmental movement Environmental scientists eventually realized almost everything ends up in soil or sediments currently large area of interest.

E N D
Soil and Sediment Toxicity Getting’ Down ‘n Dirty
Introduction • Nobody cared much about soil at the beginning of the environmental movement • Environmental scientists eventually realized almost everything ends up in soil or sediments currently large area of interest
Magnitude of Soil Contamination Problem • Large problem Soil contamination associated with worst toxic dumps in US • 30% located in Northeast • 12% in NJ (the “Garden State”) • Usually in/near metropolitan areas • Large economic losses • Spills contaminate soil, then groundwater, farmland (Toxic Real Estate) • History of mismanagement of waste by municipalities (i.e. Love Canal)
William T. Love started a canal in town of Niagra Falls, NY to connect upper and lower Niagara River for power generation. Canal abandoned when invention of AC spawned long-distance electric power. Hooker Chemicals and Plastics Corp. dumped 22,000 tons of chemical products in canal from 1920 to 1953 (with full knowledge of city officials) 1953 When full, canal backfilled with soil and presumed safe. City's Board of Ed. bought the dump site in1953, aware of chemicals (listed in deed), but ignored the problem to build a school. 1957 city punched a sewer line through Canal walls, allowing wastes to seep throughout the neighborhood sewer system Baby Boom residential development occurs along and on old dump site 1968 NY DoT builds highway along edge of site, disturbs more buried chemicals Early ’70’s People begin showing health problem, including increased cancer and birth defects The Love Canal Saga
Love Canal changes over time Love Canal in 1951 Love Canal in 1980
1978 Jimmy Carter declares area a federal emergency and 260 families are relocated Homes demolished, land fenced off 1980 – Comprehensive Environmental Response, Compensation and Liability Act (CERCLA, “Superfund”) passed EPA used CERCLA to sue Hooker, wins $129 million for clean-up. Final containment (plastic, clay cap) of most polluted soil completed in 1995 People started to move back into Love Canal because newly built houses were cheap. The Saga Continues… Demolition and soil containment Abandoned street in Love Canal, circa 2005
CERCLA • Initiated largely in response to Love Canal • Designed to identify “deep pockets” responsible for site contamination • Funded by tax on petroleum and chemical industries • > $15 billion spent since creation Photo from Wikipedia
I. What is soil? • Types very diverse • Mix of rock, weathered mineral, and organic matter • 95% is mineral matter by dry weight (but only 45% by volume) • Lots of air space (20-30% by volume) lots of room for infiltration/retention of pollutant’s
Soil Classification • Classified by composition based on particle size • Sand – coarse high infiltration, percolation • Silt – intermediate • Clay – finest less pore volume, hard to penetrate but greater long-term retention
Clay Composition • Composed of Al and Si sheets • large surface area for • Adsorption • Large sum of negative charges = high cation exchange capacity (can hold cations = large buffering capacity but many cations may be pollutants i.e. metals) • Therefore, clays can be good or bad hold more (bad) but holding may keep pollutants from being available to ecosystem (good)
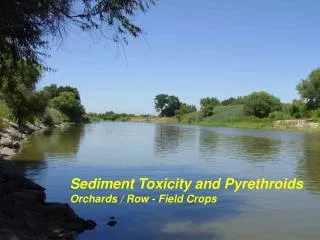
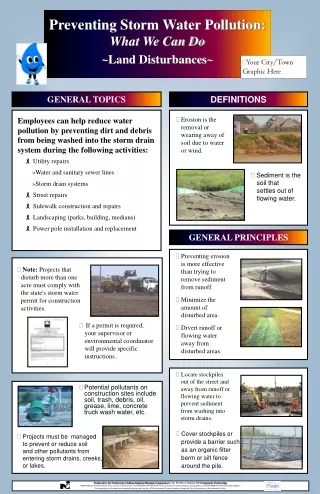
II. Sources of Soil Pollution • Direct pollution – dumping, accidental spills (trucks, trains, aeroplanes), leaks, landfills • Deposition from atmosphere (especially acid rain) • Sediments from water pollution
III. Factors Affecting Severity of Impact • Infiltration – how fast pollutant gets into the soil (how fast need to clean up?) • Percolation – how far down into the soil does it go? (reach water table?) • Retention – how long does it stay? • Buffering capacity – (adsorption capacity) – soil becomes toxic only after binding ability/reduction in availability is overcome
IV. Soil Factors Affecting Toxicology • Bulk density (g/m3) and porosity - compact soils have reduced air space = lower infiltration and percolation • pH – sorption to soil is often pH dependent (note: soils are usually good buffers hard to change pH • PCBs – decreased pH = increased adsorption = decreased toxicity • Al, Mn – become more bioavailable as decrease pH = increased toxicity • Ammonia – ammonium ion (NH4+) converted to ammonia (NH3) at high pH
IV. Soil Factors Affecting Toxicology • Topography Often determines soil properties and pollution load • Ridgetop soils – shallower, better drained than bottomland soil • Bottomland soils – greater repository for pollutants • collect from ridgetop leaching and what is purposely deposited there (remember Alice’s Restaurant) • Organic Matter Content • OM has negative ionic charge that can absorb and retain pollutants • High OM soils occur in colder climates and poor soil aeration both inhibit breakdown of OM
V. Remediation • Liming or acid addition – adjust/balance pH • Soil burning • very costly, not usually done • way to dispose of dioxin burn at 1000° C. (reason why Agent Orange burned at sea) • Soil removal • common method during early Superfund but really just moving pollutants around (Alice’s Restaurant “one trash pile better than two”) • Now just used for special cases (e.g. Radon PA, NJ, Mn)
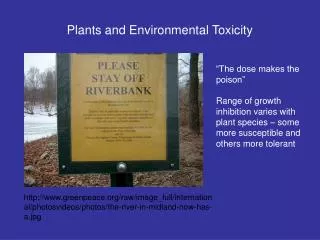
V. Remediation • Bioremediation • toxin-eating microbes good possibility for GMO’s? • Containment • put up fence and signs to keep away or DIE! • Pump and Treat • Contaminated groundwater from contaminated soil, may treat chemically or burn
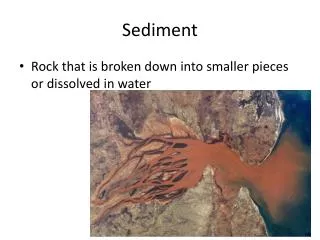
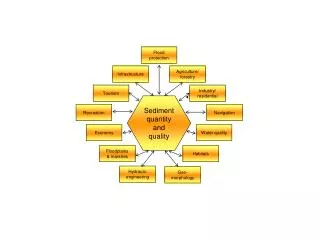
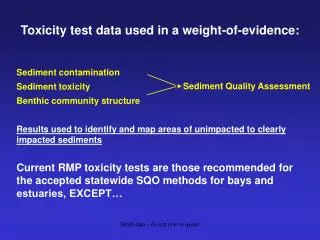
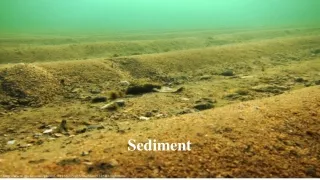
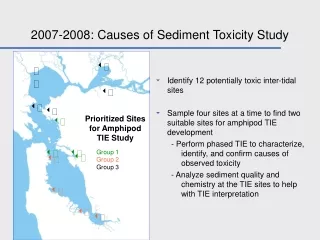
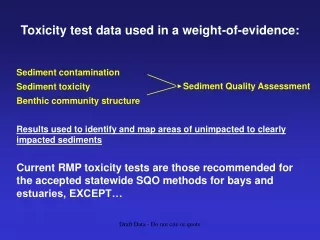
I. What are Sediments? • Also very diverse in composition • Basically aquatic environment version of soils • 1° repository for biotic and abiotic material (including pollutants) in aquatic environment • Accumulation of sediment pollutants can cause • Changes in benthic community structure • Increased body burdens • Toxicity
Sediment Classification • Organic carbon content – affects sorption of neutral organic chemicals increased Kow = increased sorption • Particle size distribution – larger particles tend to sorp fewer pollutants • Clay content and type – can change pollutant • Cation exchange capacity – affect sorption of cations • pH – affects metal speciation, sorption
II. Implications of Sediment Transport • Wind, Wave and Currents • Moves sediments around according to particle sise • Results in • Clay suspended in water columns • Sand (or larger) in high energy areas • Silt in low energy (depositional) areas Note: can cause sediment focusing • Sediment Focusing • Different sediment types carry different pollutants pollutants accumulate according to distribution of sediment to which they are attached • Example: Great Lakes DDT, methoxychlor found in fine clay particles, endosulfan on larger particles
II. Implications of Sediment Transport • Pore/Interstitial Water • Water between sediment particles • Non-polar pollutants sediments pore water overlying water column • Primary source of pollutant exposure to sediment-associated organisms • Sediments may bind pollutants, then get overlayed by non-pollution containing sediments reduce bioavailability • May be better to leave contaminated sediments in place rather than dredging them up, resuspending them and making biologially active again (e.g. lower Hudson River and New York harbor, Charles River and Boston Harbor, Potomac River and Washington estuary)