Download

1 / 53
890 likes | 1.82k Views
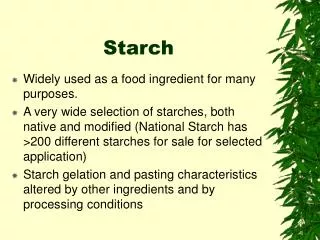
Starch Analysis. Morphology Chemical compositions Physicochemical properties Molecular structure. Amylograph. Information on pasting/gelatinizing behaviors. Instruments; Brabender Rapid Visco Analyzer (RVA).

E N D
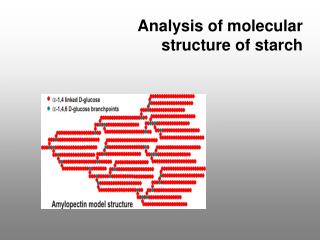
Starch Analysis • Morphology • Chemical compositions • Physicochemical properties • Molecular structure
Amylograph Information on pasting/gelatinizing behaviors • Instruments; • Brabender • Rapid Visco Analyzer (RVA)
the worldwide standard for measuring the viscosity of starch and starch containing products as a function of temperature and time.
The principle The sample is heated up within a rotating bowl and cooled down again, both under controlled conditions. Pins in the bowl provide for good mixing and prevent sedimentation. Use a simple heating - holding - cooling process, or create your own complex temperature programs for specific needs.
A measuring sensor reaching into the sample is deflected according to the viscosity of the sample in the bowl. This deflection is measured as torque -mechanically against a spring in the Viscograph Pt 100, or electronically with the Viscograph E.
Standard Procedure • a water suspension of the tested starch is heated from 25 C up to 95 C at the uniform rate of temperature increase of 1.5 C/min and under constant stirring (75 rpm) • on attaining 95 C, the sample is maintained at this temperature for 30 min (first holding period) while being continuously stirred. • the paste is then cooled down to 50 C at the specfied rate and held at this temperature for another 30 min (second holding period).
Rapid (high heating/cooling rate • Small sample (25 ml)
Microprocessor จะควบคุมการจ่ายกระแสไฟฟ้าเพื่อขับเคลื่อนให้ใบพัดหมุนผ่านสารละลายแป้ง กระแสไฟฟ้าที่ใช้จะถูกแปรเป็นหน่วยความหนืด หลักการ
Introducing the PYRIS Diamond DSCThe only DSC that gives you the whole story about your sample
What does a DSC measure? • Melting • Crystallization • Glass Transition • O.I.T. (Oxidative Induction Time) • Polymorphism • Purity • Specific Heat • Kinetic Studies • Curing Reactions • Denaturation • DSC measures the amount of energy (heat) absorbedor released by a sample as it is heated, cooled orheld at constant temperature. • A DSC precisely measures temperature. • DSC is used to analyze
Heat flux DSC: Measures temperature differential between sample sideand reference side using single, largemass furnace.Needs mathematical equations to get the heat flow. Power compensation DSC: Directly measures heat flow between sample side andreference side using two separate, low mass furnaces Types of DSC instruments
An exothermic or endothermic change occurs in the sample Power (energy) is applied or removed from the furnace to compensatefor the energy change occurring in the sample. The system is maintained in “Thermal Null” state all the times. The amount of power required to maintain the system in equilibriumis directly proportional to the energy changes. Power- Compensation Principle Platinum Alloy Sample Reference PRT Sensor Platinum Resistance Heater Heat Sink
The power - compensation DSC uses ultra low mass furnaces (< 1g) which provide the fastest controlled heating and cooling rates up to 500 C/min A heat flux furnace is 30 to 200 times larger and therefore reacts more slowly to temperature changes Power - Compensation DSC Heat flux furnace Power compensation furnace
Technical Specification Wide temperature range –180 ... 700°C great variety of applications Fast linear heating and cooling rates high sample throughput fast response time of the measuring signal High reproducibility / accuracy stable baselines over the entire temperature range precise temperature precise enthalpy DSC204-e/02.01
Technical Specificationof the DSC 204 Phoenix gas outlet air cooling protective gas reference sample heat-flux sensor furnace block (gold-plated) heating element purge gas LN2/GN2 cooling circulating cooling insulation DSC204-e/02.01
Technical Specification Standard crucibles Al (-180 ... 600°C) Pt (for the entire temperature range) DSC204-e/02.01
Measurement’s Techniques Spectrophotometry Potentiometric/Amperometric Titration Chromatographic Technique Chemical complexation (amylopectin precipitation) DSC
Lectin concanavalin A interacts with non-reducing terminal -D-glucosyl groups. Reaction with amylopectin, is not as strong as with glycogen, and amylose produces no turbidity, since the single (or few) non-reducing end group per molecule does not allow multivalent association. Protein or glycoprotein substances, usually of plant origin, that bind to sugar moieties in cell walls or membranes and thereby change the physiology of the membrane to cause agglutination, mitosis, or other biochemical changes in the cell. Ref: “Estimation and fractionation of the essentially unbranched (amylose) and branched (amylopectin) components of starches with Concanavalin A”, Norman K. Matheson and Lynsey A. Weish., 1987. “Estimation of amylose content of starches after precipitation of amylopectin by Concanavalin A”, Yun S. and Norman K. Matheson, Starch/Starke, 1990.
The carbohydrate binding site in Concanavalin A is highlighted in green. Note how it is formed from surface loop structures
Spectrophotometry Starch-Iodine-Blue Value Analysis (late 1950's) Halick, J.V. and Keneaster, K.K. 1956. The use of a starch-iodine-blue test as a quality indicator of white milled rice. Cereal Chem 33:315-319. Milled rice is ground into a flour, water is added and the solution is heated. The solution is then filtered and iodine and hydrochloric acid solutions are added to the filtrate. A complex then forms between the iodine and the amylose. The intensity of the resulting blue color is measured in a spectrophotometer as the iodine-blue value. This method is rapid but it does not consistently correlate with more accurate measures of milled rice amylose content.
Apparent Amylose Content Determination (early 1970's) Juliano, B.O. 1971. A simplified assay for milled-rice amylose. Cereal Sci Today 16:334-336, 338, 360. Milled rice is ground into a flour and then dispersed in water by first treating it with ethanol and sodium hydroxide. The solution is heated for an hour or allowed to set at room temperature overnight. The pH is then adjusted using acetic acid and a solution of iodine is added. The amylose present in the rice forms a complex with the iodine. The color change (measured using a spectrophotometer) in the solution is correlated to the amount of the iodine-amylose complex that is formed. Samples (standards) with known amounts of amylose are also run at the same time. Results are calculated by comparing the sample's color change to that of the standards. This method is relatively rapid because protein and lipids do not need to be removed from the rice prior to using this method. Also, a very small quantity of sample is required.
the colored amylose-iodine complex was sensitive to changes of pH in the alkaline/neutral region. • Fatty acids derived from fat during starch dispersion reduce the starch-iodine blue color by competing with iodine in complexing with amylose. • The blue color is unstable at higher pH but a greenish blue color is obtained at low pH. • Acetic acid has the advantage of buffering action and lower variation than hydrochloric acid. • the blue amylose-iodine complex was stable in acidic medium, however, hydrochloric, sulfuric, nitric acids could not be used, because they precipitated the amylose-iodine complex. • Using dilute trichloroacetic acid, no precipitation of the colored complex occurred, even after long standing at RT. The color was more stable, and less sensitive to experimental conditions, than that developed in neutral or alkaline medium.
Chromatographic Technique Ref: Effect of amylose molecular size and amylopectin branch chain length on paste properties of starch, Jay-Lin Jane and Jen-Fang Chen, Cereal Chem., 1992. Gel preparation: Soak the gel (Sephacryl S-400 HR/S-500 HR, Sepharose CL-2B) with water overnight Decant the water Wash the gel with DW (2 times)
Size Exclusion Chromatography Figure 2Illustrative description of separation of size exclusion chromatography (SEC).
Experimental Procedure Amylose content determination by SEC Starch Nongranular starch Size Exclusion Chromatography Total carbohydrate (Phenol-H2SO4, Dubois et al., 1956) & blue value (I2 binding)