Download
1 / 44
450 likes | 575 Views
Cluster Identification and Reconstruction through Voronoi and Delaunay Tessellations. Christian Marinoni . Centre de Physique Th éorique Marseille. The world a Jigsaw. Leiden, 6-10 March 2006. R. Descartes . Le monde ou Trait é de la Lumi ère 1644. Outline. What is a galaxy cluster.

E N D
Cluster Identification and Reconstruction through Voronoi and Delaunay Tessellations Christian Marinoni Centre de Physique Théorique Marseille The world a Jigsaw Leiden, 6-10 March 2006
R. Descartes Le monde ou Traité de la Lumière 1644
Outline • What is a galaxy cluster • A cluster finding tool based on 3D Voronoi-Delaunay geometry • Tests of performances • Reconstructing the overdensity PDF in the deep Universe
The cluster includes the galaxies and any material which is in the space between the galaxies Xray image (hot gas which shines in the X)
Sunyaev-Zeldovich effect: CMB photons through hot electron cloud
2D optical identification - look for red galaxies - look for light deflection (gravitational lenses) 2D X ray identification - look for diffuse gas • Groups are weak enhancements in the overall clustering • pattern need to increase the detection S/N adding • third dimension (depth) • Need to identify peaks but also reconstruct individual • galaxy membership • Need to do this for very distant systems • (faint objects, rare event statistics, ….)
Not so easy to work in 3D……. Galaxies are observed in redshiftspace (z) and not physical space (d) Hubble laws: relation between cosmological redshift (due to cosmic expansion) and galaxy distances Redshift z not entirely cosmological. Also doppler contributions due to peculiar velocities generated by local gravitational phenomena add to observed redshift Hubble law breaks down On small scales velocities lead to elongated structures called “Fingers of God” clusters are smeared out along the line of sight
Maps appear to present Fingers of God pointing to the earth as if we were the centre of the universe
Real space z space
Groups are “ perverse examples of the topological effect of the algorithm used” Kirshner 1977 “We strongly believe that it will never be possible to assign Individual galaxies to groups or field in a definitive way. Any Such approach cannot possibly yield reliable results” Faber & Gallagher 1979
Galaxy Cluster Abundance tells us aboutgeometry and energy content of the Universe Clusters relatively simple objects. Evolution of massive cluster abundance determined by gravity. # of clusters per unit area and z: mass function comoving volume mass function: Jenkins et al. 2001 Hubble volume N-body simulations in three cosmologies cf: Press-Schechter overall normalization power spectrum (8, n) growth function
Outline • What is a galaxy cluster • A cluster finding tool based on 3D Voronoi-Delaunay geometry • Tests of performances • Reconstructing the overdensity PDF in the deep Universe
The Standard Algorithm • Friends of Friends (percolation) method • (Huchra & Geller 1982) • Define a set of linking/threshold parameters • Decide how to scale it with redshift [D(z),L(z)]
Problems with the percolation approach • 3 arbitrary (non-physical, non-local) parameters • Over-merging of structures in dense regions • (destroy sub-cluster elements) • Objects are linked by “bridge galaxies” and not by the • “cluster gravitational potential”
Sample: Deep “cone” (2h Field: first-epoch data) z=1.5 • ~7000 galaxies with secure redshifts, IAB24 • Coverage: • 0.7x0.7 sq. deg • (40x40 Mpc at z=1.5) • Volume sampled: • 2x10⁶ Mpc3 (~CfA2) (1/16th of final goal) 4300 Mpc • Mean inter-galaxy separation at z=0.8 • <l>~4.3 Mpc (~2dF at z=0.1) • Sampling rate: 1 over 3 galaxies down to I=24 z=0
Problems with the percolation approach Local Universe Deep Universe
We want….. Adaptive algorithm (no global parameters) which implements physical (not simply geometrical) prescriptions which reconstructs not only the rare high density peaks but the whole hierarchy from small groups to rich clusters Minimize contamination and fake detection Assess completeness of the reconstruction scheme
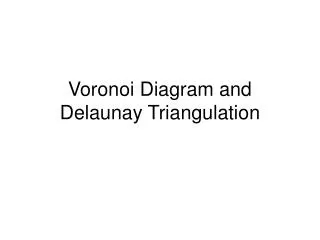
Voronoi Diagram is a geometric structure that can be used to performe non parametric data smoothing: Natural way to measure packing Identification of galaxy peaks in the galaxy distribution A Delaunay mesh describes the ensemble of neighboring galaxies: natural way to define cluster members Reconstruction of neighborod relationships
Algorithm IIdentify central galaxies of a clusters
3D Voronoi Representation of a group with 10 galaxies Real space Redshift space
Is the densest Voronoi cell at the center of a cluster in Z-space?
Algorithm IIDetermine the k-order Delaunay neighbours of the peak within a fixed L.o.S. cylinder (R,L>>R) This way we recover a physical quantity: the cluster projected central density
Algorithm K-order Delaunay neighbours tells you how big the underlying cluster is Virial relationship Process all the N>K Delaunay orders with an inclusion-exclusion logic (very fast)
Outline • What is a galaxy cluster • A cluster finding tool based on 3D Voronoi-Delaunay geometry • Tests of performances • Reconstructing the overdensity PDF in the deep Universe
Outline • What is a galaxy cluster • A cluster finding tool based on 3D Voronoi-Delaunay geometry • Tests of performances • Reconstructing the overdensity PDF in the deep Universe
The Density Field (smoothing R=2Mpc) 2DFGRS/SDSS stop here Marinoni et al. 2006
Filaments Walls
The Density Field (smoothing R=2Mpc) TheProbabilityDistributionFunction(PDF) of galaxy overdensities Probability of having a density fluctuation in the range (,+d) within a sphere of radius R randomly located in the survey volume fR() High density Low density 2DFGRS/SDSS stop here Marinoni et al. 2006
Time Evolution of the galaxy PDF The 1P-PDF of galaxy overdensities g () R Z=1.1-1.5 Independent data statistics Masked area exclusion Z=0.7-1.1 Volume limited sample M<-20+5log h
Time Evolution of the galaxy PDF The 1P-PDF of galaxy overdensities g () R Z=1.1-1.5 • The PDF is different • at different cosmic • epochs Z=0.7-1.1 • Systematic shift of the • peak towards low • density regions as a • function of cosmic time • Cosmic space • becomes dominated by • low density regions at • recent epochs Volume limited sample M<-20+5log h
Theoretical Interpretation Gravitational instability in an Expanding Universe
Measuring the galaxy bias up to z=1.5 with the VVDS Marinoni et al. 2005 A&A in press astro-ph/0506561 Bias: difference in distribution of DM and galaxy fluctuations Linear Bias Scheme: (Kaiser 1984) • Redshift evolution • Non linearity • Scale dependence Our goal: Marinoni & Hudson 2002 Ostriker et al. 2003 Strategy • Derive the biasing function
The PDF of galaxy overdensities g(): Shape R Coles & Jones 1991 Z=1.1-1.5 Z=0.7-1.1
The biasing function: 2) Shape b() z • Galaxy bias depends on redshift: it encreases as z increases • At present epochs galaxies form also in low density • regions, while at high z the formation process is inhibited in • underdensities
Conclusion Reconstruction algorithm based on a virial definition of custer of mass points: Only two parameters (with immediate physical interpretation) Minimizes spourious distance-dependent effects Wide dynamical range: perform optimally over the whole systems mass range from small groups To rich clusters