Download
1 / 39
390 likes | 643 Views
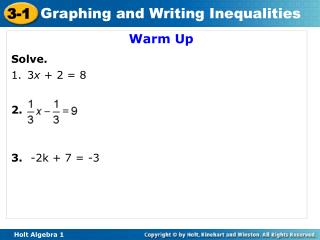
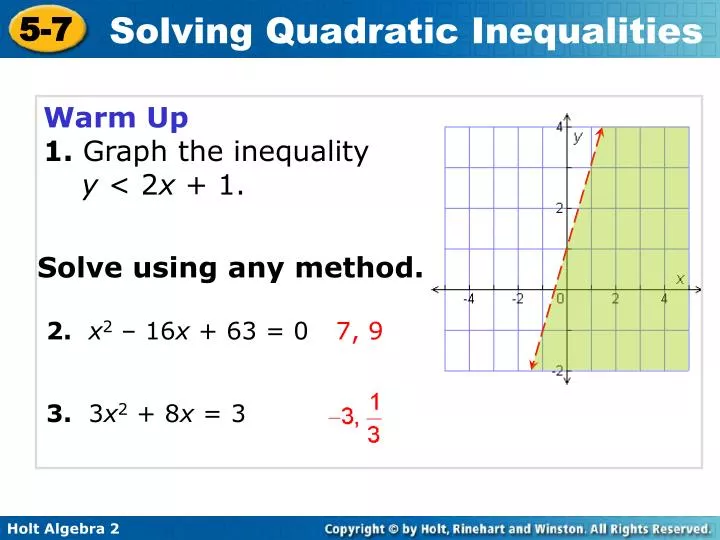
Warm Up 1. Graph the inequality y < 2 x + 1. Solve using any method. 2. x 2 – 16 x + 63 = 0. 7, 9. 3. 3 x 2 + 8 x = 3. Objectives. Solve quadratic inequalities by using tables and graphs. Solve quadratic inequalities by using algebra. Vocabulary.

E N D
Warm Up 1. Graph the inequalityy < 2x + 1. Solve using any method. 2. x2 – 16x + 63 = 0 7, 9 3. 3x2 + 8x = 3
Objectives Solve quadratic inequalities by using tables and graphs. Solve quadratic inequalities by using algebra.
Vocabulary quadratic inequality in two variables
Many business profits can be modeled by quadratic functions. To ensure that the profit is above a certain level, financial planners may need to graph and solve quadratic inequalities. A quadratic inequality in two variables can be written in one of the following forms, where a, b, and c are real numbers and a ≠ 0. Its solution set is a set of ordered pairs (x, y).
y < ax2 + bx + c y > ax2 + bx + c y ≤ ax2 + bx + c y ≥ ax2 + bx + c In Lesson 2-5, you solved linear inequalities in two variables by graphing. You can use a similar procedure to graph quadratic inequalities.
Example 1: Graphing Quadratic Inequalities in Two Variables Graph y ≥ x2 – 7x + 10. Step 1 Graph the boundary of the related parabola y = x2 – 7x + 10 with a solid curve. Its y-intercept is 10, its vertex is (3.5, –2.25), and its x-intercepts are 2 and 5.
Example 1 Continued Step 2 Shade above the parabola because the solution consists of y-values greater than those on the parabola for corresponding x-values.
Example 1 Continued Check Use a test point to verify the solution region. y ≥ x2 – 7x + 10 0 ≥ (4)2–7(4) + 10 Try (4, 0). 0 ≥ 16 – 28 + 10 0 ≥ –2
Check It Out! Example 1a Graph the inequality. y ≥ 2x2 – 5x – 2 Step 1 Graph the boundary of the related parabola y = 2x2 – 5x – 2 with a solid curve. Its y-intercept is –2, its vertex is (1.3, –5.1), and its x-intercepts are –0.4 and 2.9.
Check It Out! Example 1a Continued Step 2 Shade above the parabola because the solution consists of y-values greater than those on the parabola for corresponding x-values.
Check It Out! Example 1a Continued Check Use a test point to verify the solution region. y < 2x2 – 5x – 2 0 ≥ 2(2)2– 5(2) – 2 Try (2, 0). 0 ≥ 8 – 10 – 2 0 ≥ –4
Check It Out! Example 1b Graph each inequality. y < –3x2 – 6x – 7 Step 1 Graph the boundary of the related parabola y = –3x2 – 6x – 7 with a dashed curve. Its y-intercept is –7.
Check It Out! Example 1b Continued Step 2 Shade below the parabola because the solution consists of y-values less than those on the parabola for corresponding x-values.
Check It Out! Example 1b Continued Check Use a test point to verify the solution region. y < –3x2 – 6x –7 –10 < –3(–2)2– 6(–2) – 7 Try (–2, –10). –10 < –12 + 12 – 7 –10 < –7
Reading Math For and statements, both of the conditions must be true. For or statements, at leastone of the conditions must be true. Quadratic inequalities in one variable, such as ax2 + bx + c > 0 (a ≠ 0), have solutions in one variable that are graphed on a number line.
Example 2A: Solving Quadratic Inequalities by Using Tables and Graphs Solve the inequality by using tables or graphs. x2 + 8x + 20 ≥ 5 Use a graphing calculator to graph each side of the inequality. Set Y1 equal to x2 + 8x + 20 and Y2 equal to 5. Identify the values of x for which Y1≥ Y2.
–6 –4 –2 0 2 4 6 Example 2A Continued The parabola is at or above the line when x is less than or equal to –5 or greater than or equal to –3. So, the solution set is x ≤ –5 or x ≥ –3 or (–∞, –5] U [–3, ∞). The table supports your answer. The number line shows the solution set.
Example 2B: Solving Quadratics Inequalities by Using Tables and Graphs Solve the inequality by using tables and graph. x2 + 8x + 20 < 5 Use a graphing calculator to graph each side of the inequality. Set Y1 equal to x2 + 8x + 20 and Y2 equal to 5. Identify the values of which Y1< Y2.
–6 –4 –2 0 2 4 6 Example 2B Continued The parabola is below the line when x is greater than –5 and less than –3. So, the solution set is–5 < x < –3 or (–5, –3). The table supports your answer. The number line shows the solution set.
Check It Out! Example 2a Solve the inequality by using tables and graph. x2 – x + 5 < 7 Use a graphing calculator to graph each side of the inequality. Set Y1 equal to x2 – x + 5 and Y2 equal to 7. Identify the values of which Y1< Y2.
–6 –4 –2 0 2 4 6 Check It Out! Example 2a Continued The parabola is below the line when x is greater than –1 and less than 2. So, the solution set is–1 < x < 2 or (–1, 2). The table supports your answer. The number line shows the solution set.
Check It Out! Example 2b Solve the inequality by using tables and graph. 2x2 – 5x + 1 ≥ 1 Use a graphing calculator to graph each side of the inequality. Set Y1 equal to 2x2 – 5x + 1 and Y2 equal to 1. Identify the values of which Y1≥ Y2.
–6 –4 –2 0 2 4 6 Check It Out! Example 2b Continued The parabola is at or above the line when x is less than or equal to 0 or greater than or greater than or equal to 2.5. So, the solution set is(–∞, 0] U [2.5, ∞) The number line shows the solution set.
The number lines showing the solution sets in Example 2 are divided into three distinct regions by the points –5 and –3. These points are called critical values. By finding the critical values, you can solve quadratic inequalities algebraically.
Example 3: Solving Quadratic Equations by Using Algebra Solve the inequality x2 – 10x + 18 ≤ –3 by using algebra. Step 1 Write the related equation. x2 – 10x + 18 = –3
Example 3 Continued Step 2 Solve the equation for x to find the critical values. x2 –10x+ 21 = 0 Write in standard form. (x– 3)(x – 7) = 0 Factor. Zero Product Property. x– 3 = 0 or x – 7 = 0 Solve for x. x=3 or x = 7 The critical values are 3 and 7. The critical values divide the number line into three intervals: x ≤ 3, 3 ≤ x ≤ 7, x ≥ 7.
Critical values –3 –2 –1 0 1 2 3 4 5 6 7 8 9 Test points Example 3 Continued Step 3 Test an x-value in each interval. x2 – 10x + 18 ≤ –3 Try x = 2. (2)2 – 10(2) + 18 ≤ –3 x (4)2 – 10(4) + 18 ≤ –3 Try x = 4. Try x = 8. x (8)2 – 10(8) + 18 ≤ –3
–3 –2 –1 0 1 2 3 4 5 6 7 8 9 Example 3 Continued Shade the solution regions on the number line. Use solid circles for the critical values because the inequality contains them. The solution is 3 ≤ x ≤ 7 or [3, 7].
Check It Out! Example 3a Solve the inequality by using algebra. x2 – 6x + 10 ≥ 2 Step 1 Write the related equation. x2 – 6x + 10 = 2
Check It Out! Example 3a Continued Step 2 Solve the equation for x to find the critical values. x2 – 6x+ 8 = 0 Write in standard form. Factor. (x– 2)(x – 4) = 0 Zero Product Property. x– 2 = 0 or x – 4 = 0 Solve for x. x=2 or x = 4 The critical values are 2 and 4. The critical values divide the number line into three intervals: x ≤ 2, 2 ≤ x ≤ 4, x ≥ 4.
Critical values Test points –3 –2 –1 0 1 2 3 4 5 6 7 8 9 Check It Out! Example 3a Continued Step 3 Test an x-value in each interval. x2 – 6x + 10 ≥ 2 Try x = 1. (1)2 – 6(1) + 10 ≥ 2 (3)2 – 6(3) + 10 ≥ 2 x Try x = 3. (5)2 – 6(5) + 10 ≥ 2 Try x = 5.
–3 –2 –1 0 1 2 3 4 5 6 7 8 9 Check It Out! Example 3a Continued Shade the solution regions on the number line. Use solid circles for the critical values because the inequality contains them. The solution is x ≤ 2 or x ≥ 4.
Check It Out! Example 3b Solve the inequality by using algebra. –2x2 + 3x + 7 < 2 Step 1 Write the related equation. –2x2 + 3x + 7 = 2
Check It Out! Example 3b Continued Step 2 Solve the equation for x to find the critical values. –2x2 + 3x+ 5 = 0 Write in standard form. (–2x+ 5)(x + 1) = 0 Factor. Zero Product Property. –2x+ 5 = 0 or x + 1 = 0 Solve for x. x=2.5 or x = –1 The critical values are 2.5 and –1. The critical values divide the number line into three intervals: x < –1, –1 < x < 2.5, x > 2.5.
Critical values –3 –2 –1 0 1 2 3 4 5 6 7 8 9 Test points Check It Out! Example 3b Continued Step 3 Test an x-value in each interval. –2x2 + 3x + 7 < 2 –2(–2)2 + 3(–2) + 7 < 2 Try x = –2. –2(1)2 + 3(1) + 7 < 2 x Try x = 1. –2(3)2 + 3(3) + 7 < 2 Try x = 3.
–3 –2 –1 0 1 2 3 4 5 6 7 8 9 Check It Out! Example 3 Shade the solution regions on the number line. Use open circles for the critical values because the inequality does not contain or equal to. The solution is x < –1 or x > 2.5.
Remember! A compound inequality such as 12 ≤ x ≤ 28 can be written as {x|x ≥12 U x ≤ 28}, or x ≥ 12 and x ≤ 28. (see Lesson 2-8).
Lesson Quiz: Part I 1. Graph y ≤ x2 + 9x + 14. Solve each inequality. 2.x2 + 12x + 39 ≥ 12 x ≤ –9 or x ≥ –3 3.x2 – 24 ≤ 5x –3 ≤ x ≤ 8
Lesson Quiz: Part II 4. A boat operator wants to offer tours of San Francisco Bay. His profit P for a trip can be modeled by P(x) = –2x2 + 120x – 788, where x is the cost per ticket. What range of ticket prices will generate a profit of at least $500? between $14 and $46, inclusive