Download
1 / 25
260 likes | 411 Views
Characterization of rock samples from Äspö. Some results from EU-CROCK Project WP1. Annual Science Meeting of the National Geosphere Laboratory Oskarshamn 2013-11-07. Stellan Holgersson. Introduction. CROCK – Crystalline Rock Retention Processes www.crockproject.eu. The aim :

E N D
Characterization of rock samples from Äspö Someresults from EU-CROCK Project WP1 Annual Science Meeting of the National GeosphereLaboratory Oskarshamn 2013-11-07 Stellan Holgersson
Introduction CROCK – Crystalline Rock Retention Processes www.crockproject.eu The aim: ”to decreaseconservatismin the crystallinehost-rock high level wasterepositoryfar-fieldsafetyassessment” The approach: “The experimental program reaches from the nano-resolution to the relevant real site scale, delineating physical and chemical retention processes. Existing and new analytical information provided within the project is used to set up step-wise methodologies for up-scaling of processes from the nano-scale through to the km-scale. Modeling includes testing up-scaling process and parameters for the application to Performance Assessment and in particular, the reduction of uncertainty.”
Introduction CROCK – Crystalline Rock Retention Processes www.crockproject.eu • Work Packages: • WP1: Organization and characterization of rock samples from Äspö • WP2: Experimental (laboratoryscale) sorption/migration studies • WP3: Naturalhomologues and real system analysesusingexistingdatabases • WP4: Conceptualization of results from WP1-3 and modelling • WP5: Application to modelling of a safetycase • + documentation, etc Project leader : KIT (DE) Participants: AMPHOS (ES), CIEMAT (ES), CONTERRA (SE), CTH (SE), FZD (DE), KEMAKTA (SE), NRI (CZ), VTT (FI)
Background Contaminant transport in the geosphere: Picture from USGS (www.ga.water.usgs.gov) A general problem that (should) concern all of us
Background Contaminant transport in the geosphere: Potential sources Landfills Natural ores Waste repositories Former industrial sites
Contamination Transport Contaminant transport in the geosphere: conceptual model (1) pores pores fractures Industrial sites pores animation courtesy: I. Dubois
Contamination Transport Contaminant transport in the geosphere: conceptual model (2) M+ M+ Contaminant metal is adsorbed on surface oxygen sites (chemical retention) adsorption depends on surface area Industrial sites Q: the area and porosity are connected, but how? and the available porosity
Objectives Preparation of samples for sorption and diffusion experiments Determination of Specific Surface Area SSA (m2/g) Determination of SpecificPoreVolume SPV (mL/g) Determination of apparentdensity (kg/m3)
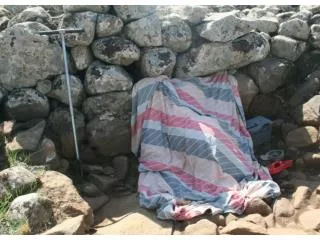
Sampling at Äspö Drilling in NASA2376A, May 2011... to obtain drill-cores.. ..preserved in inert atmosphere. photos courtesy: S. Buechner
Selection of one drill core • Sample ”1.30a” taken from 12.1-12.4m depth from tunnel wall • Perpendicularfractures at bothends • Cutintoroughly 1.5cm longsections with a diamondsaw in N2glove-box • Samplesa-h for sorption, A-H for diffusion fracture surfaces a,A,b,B,c,C,d,D,e,E,f,F,g,G,h,H,I
Further preparations • The 8 samples for batchsorption • werecrushed and sievedintofour • fractions: • 1-0.5mm, • 0.5-0.25mm, • 0.25-0.125mm, • 0.125-0.063mm, • giving in total 32 fractions • The 8 samples for diffusion were • lined with epoxi resin
Specific Surface Area (SSA) measurements • Kr gas adsorption instrument, using the • BET(1model for gas adsorption isotherm • All 17 intactsamples (a-h, A-H,I) were • measured, using 2-4 pressure points • Crushedsamples (a-h) wasthen • measured, using 7-10 pressure points 1)Brunauer, S., Emmet, P.H. and Teller, E.: Adsorption of gases in multimolecular layers. J.Am. Chem. Soc. 60 (2), 309-319 (1938).
SSA measurements: Results Äspö rock non-porous smooth spherical particles
SpecificPoreVolumemeasurements • N2 gas adsorption instrument, using BJH(1model for isotherm • Crushedsamples (a-h) measured, using 90-100 pressure points (absorbtion+desorption) • For intactsamples (A-H) the 3H2O diffusion wasused, sinceno porositycan be detected with gas adsorption rock discmounted in diffusion cell 1)Barrett, E.P., Joyner, L.G. and Halenda, P.P.: The determination of pore volume and area distributions in porous substances. I. Computations from nitrogen isotherms. J.Am. Chem. Soc. 73 (1), 373-380 (1951).
SPV measurements: Resultsintactsections • SPV calculated from porosity, usingmeasuredapparentdensities for eachsection (mean 270421kg/m3)
SPV measurements: Results 3H2O diffusion measurements gas adsorption measurements ? approx. detectionlevel w. gas adsorption
Results to explain: Why is it a linear slope for SSA and SPV when plotting them versus particle size? Why does the large intact disc material follow this trendline in the case with SSA but not with SPV?
The lineardependency of SSA and SPV with particlesize: • The lineardependency is consistent with a modelwhereparticlescontain2-zone porosity: oneouterlargerporosity (”disturbedzone”) with constantthickness and one inner core of lowerporosity
Larger SPV for intact material thanpredicted from crushed material This phenomena can be explained with two pore types: mesopores (size <0.5m) measurable with gas adsorption in crushed material. These pores contributes to SSA and SPV. For intact material, however, the mesoporousSPV is too small to be measured with gas adsorption. macropores (size >0.5m) not measurable with gas adsorption in either crushed or intact material, because the gas do not condense in these large pores. The macroporous SPV shows up only with 3H2O diffusion in intact material. It probably has a negligable SSA in comparison with the mesoporous SPV.
Conclusions • The measuredSSA with gas adsorption can be described with a 2- • zoneporositymodel: a high porosityzonesurrounding a lowporous • core • For SSA the model is consistent over the wholesizerange that were • investigated • The measuredSPV with gas adsorption/condensationcanalso be • described with the same 2-zone porositymodel • For SPV the model is consistentonly for the smallerparticles • To explain the relativelylarge SPV in the intactdiscsamples, the • presence of macropores (small fractures or ”fissures”) can be assumed
Acknowledgements • Henrik Drake, Thorsten Schäfer, Sebastian Büchner and the MiRo drilling team are gratefully acknowledged for help with sampling of the drill cores. • The research leading to these results has received funding from the European Union's European Atomic Energy Community's (Euratom) Seventh Framework Programme FP7/2007-2011 under grant agreement n° 269658 (CROCK project) and SKB, the Swedish Nuclear Fuel and Waste Management Company.