Download
1 / 50
570 likes | 863 Views
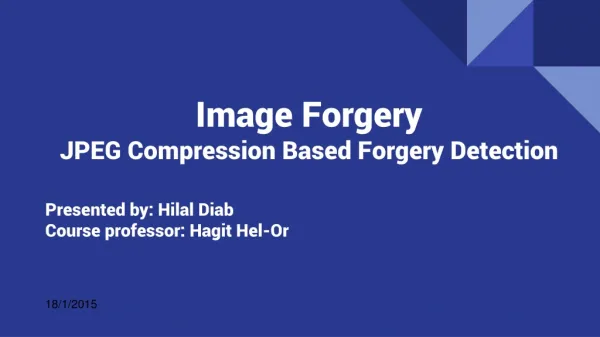
A robust detection algorithm for copy-move forgery in digital images. Presented by Issam Laradji. Authors: Yanjun Cao, Tiegang Gao , Li Fan, Qunting Yang Course: COE589-Digital Forensics Date: 18 September, 2012. Outline. Introduction Challenges Background Concepts

E N D
A robust detection algorithm for copy-move forgery in digital images Presented by IssamLaradji Authors: Yanjun Cao, TiegangGao, Li Fan, Qunting Yang Course: COE589-Digital Forensics Date: 18 September, 2012
Outline • Introduction • Challenges • Background Concepts • Related Work • Proposed Approach • Experimental Results • Summary Most definitions were obtained from Wikipedia, others are from online tutorials
Introduction • Some statistics state that around 20% of accepted manuscripts are tempered • 1% are fraudulent manipulations • Innocent people can get framed of crimes they didn’t commit • Negative social impact • Premature propaganda
Challenges • Sophisticated tools • 3D Max, Photoshop • Automated lighting, and processing that conceal forgery • Increase of large size images • High-definition images • Much more costly to process
Background Concepts • Normal Distribution • Used to describe real-valued random variables that cluster around a single mean value • The most prominent distribution • All distributions areas add up to 1, bell-shaped • Allows for tractable analysis • Observational error in an experiment is usually assumed to follow a normal distribution • Has a symmetric distribution about its mean Normal distribution formula
Background Concepts (2) • Energy of the image • Amount of information present: • High energy: city, lots of details • Low energy: plain, minimal details • Feature vector • N-dimensional vector of numerical features to represent some object • Facilitates statistical analysis • Explanatory “independent” variables used in procedures such as linear regression
Background Concepts (3) • Feature vector cont. • Linear regression can be used to model the relationship between independent variable X (Feature vector) and dependent variable Y • least square is commonly used for fitting • Time Complexity • The time complexity of an algorithm quantifies the amount of time taken by an algorithm to run as a function of the length of the variables representing the input
Background Concepts (4) • Global and local features • Global features represent details about the whole image • Color distribution, brightness, and sharpness • Faster to process • Local features represent more finer details such as the relationship between pixels • Similarities and differences between pixels • Much more costly in processing
Background Concepts (5) • Eigenvector & Eigenvalue • Aneigenvector of a square matrix is a non-zero vector that, when multiplied by the matrix, yields a vector that is parallel to the original • The eigenvalue is the scalar value that corresponds to the eigenvector λ • In this case, [3;-3] is an eigenvector of A, with eigenvalue 1 (MATLAB syntax)
Background Concepts (6) • Principal analysis component • Mathematical procedure that uses orthogonal transformation • Converts correlated variables to linearly uncorrelated variables called principal components • Principal components are guaranteed to be independent only if the data set is normally distributed • Identifies patterns in data • Highlighting their similarities and differences
Background Concepts (7) • Principal analysis component cont. • Eigenvalue decomposition of data correlation • Eigenvalues obtained can measure weights of different image features • Main advantage • Data compression without much loss of information • Applications • Data mining, image processing, marketing, and chemical research
Background Concepts (8) • Scale-invariant feature transform (or SIFT) • An algorithm in computer vision to detect and describe local features in images • Local image features helps in object recognition • Invariant to image scale and rotation • Robust to changes in illumination, noise, and minor changes in viewpoint • Applications • Object/face recognition, navigation, gesture recognition, and tracking
Background Concepts (9) • Discrete Cosine transform • Transforms image from spatial to “frequency domain” in which it can be efficiently encoded • Discard high frequency “sharp variations” components which refines the details of the image • Focuses on the low frequency “smooth variations”, holds the base of an image DCT basis (64) Zigzag scanning
Background Concepts (10) • Discrete Cosine transform cont. • Removes redundancy between neighboring pixels • Prepares image for compression / quantization • Quantization: • Maps large set of values to smaller set • Reduces the number of bits needed to store the coefficients by removing less important high frequency.
Background Concepts (11) • Why DCT? • Approximates better with fewer coefficients as compared to other contemporary transforms • However wavelet transforms is the new trend • Less space required to represent the image features, hence easier to store in memory • Applications: • Lossy compression for .mp3 and .jpg
Related Work • Straightforward approach • Compare each group of pixels with the rest, and check for similarities! • Very impractical, exponential time complexity • False positives could be high • Related work • Exhaustive search • Fridrich used DCT-based features for duplication detection • Sensitive to variations (additive noise)
Related Work (2) • Haung et al. increased performance by reducing feature vector dimensions • However, none considered multiple copy-move forgery • Popescu: PCA-based feature, • Can endure additive noise • Low in accuracy
Related Work (3) • Luo proposed color features as well as block intensity ratio • Bayram et al. applied Fourier-Mellin transform to each block, then projected to one dimension to form the feature vector • B. Mahdian, and S. Saic used a method based on blur moments invariants to locate the forgery regions • X. Pan, and S. Lyu took the advantages of SIFT features to detect the duplication regions • However, all these are of higher time complexity than the proposed approach!
Proposed Approach • Basically, the algorithm divides the original image into overlapping blocks, then similarities between these blocks are calculated, based on some threshold the duplicated regions are highlighted in the output image
Proposed approach advantages (contributions) • Improved version of copy-move forgery detection algorithm • Lower feature vector dimension • Robust to various attacks: multiple copy-move forgery, Gaussian blurring, and noise contamination • Lower time complexity
Step 1- dividing the image into blocks • Say we have an input image of size m x n • If its not gray scale • The image is converted to Grayscale using the formulae: I=0.228R+0.587G+0.114B • Human eye is most sensitive to green and red • That’s why most weights are on green and red Green channel gives the clearest image
B B B B m n Step 1- dividing the image into blocks (2) • The input image is split into overlapping blocks • The standard block size is 8 x 8 Generates (m-b+1)(n-b+1) = N Blocks • Each block differ by one row or one column by its preceding block • Let ‘N’, and ‘b’ be the number of blocks obtained, and the height • of the block respectively
Step 1- dividing the image into blocks (3) Block size : 8 x 8 Dividing into blocks … … Original image Complexity: O(N) where N is the number of blocks
DCT Transform Step 2 – Applying DCT transform • For each block, DCT is applied • We get DCT coefficients matrix DCT coefficient block Original Sample block
Step 2 – Applying DCT transform (1) • The block is compared with its 64 DCT basis to get the correlation coefficients DCT basis (64) Discrete Coefficients
Step 2 – Applying DCT transform (2) • The transformation allows us to focus on the low frequency coefficients which hold the basis of the image • Zigzag extraction is done so that coefficients are in order of increasing frequency • Allows for zeroing the high frequency blocks • Time complexity: O(N x b x b) (a) the Lena image (b) Zigzag order scanning (c) the reconstruction image of Lena by using 1/4 DCT coefficients.
Generate matching feature : C1 C2 C4 C3 Step 3 – feature extraction • The coefficients matrix are divided and represented by four parts: C1,C2, C3, and C4 • p_ratio=c_area/m_area is approximately 0.79 • The circle block represents the low frequency, hence decreasing the computation cost without affecting efficiency DCT coefficient block
C1 C2 ≒ 145.2746 C4 C3 ≒ 0.8715 ≒ -0.0095 Step 3 – feature extraction (2) • Each v is quantized by its corresponding c_area • Four features that represent the matrix are obtained • vi is the mean of the coefficients value, corresponding to each ci Matching features generated: DCT coefficient block
Step 3 – feature extraction (3) • The extracted features are invariant to a lot of processing operations according to the results below • Time complexity of feature extraction: O(N x 4 x b x b)
Step 4 – Matching • The extracted feature vectors are arranged in a matrix A • A is then lexicographically sorted , with time complexity of O(N log N) • Each element (vector) of A is compared to each subsequent vector to check if the thresholds Dsimilar, Nd, are satisfied i.e. the equations:
Not Similar Step 4 – Matching (2)
≒ 127.28 Similar Detected image Step 4 – Matching (3)
Step 5 – Displaying duplicated regions • Finally, regions showing the duplicated regions are expected to be displayed The green rectangles indicate a duplicated region The computational complexities of extraction methods are compared
Time complexity analysis • As claimed, the total computation complexity: • O(N)+O(Nxbxb)+O(Nx4xbxb)+O(4NxlogN) • Where N, b are the number of blocks and the height of the block respectively • Questionable? • The computation complexity of matching was not calculated which could be O(NxN) • However, they stated that their computational complexity is dominated by the matching blocks
Experimental results - environment • Photoshop 8.0 • 2.59 GHz, AMD processor • Matlab2009a software • First dataset • Gray images of size of 128 x 128 • DVMM lab at Columbia University • Second dataset • uncompressed colour PNG images of size 768 x 521 • the Kodak Corporation • Third dataset • Internet collection of images of size 1600 x 1000
Experimental results - Setting Thresholds • Detection accuracy rate (DAR) and False positive rate (FPR) • psis & “psis tilde” are set as the copy region, and the detected copy respectively • psit and “psit tilde” are set as the tampered region and detected tampered respectively • Questionable? • Vague formulas • Nothing in the paper have shown what the symbols really mean • Accuracy check is normally calculated in ratios
Experimental results - Setting Thresholds (2) • Selecting the circle representation for matching features extraction can be challenging • Therefore, 200 images are randomly chosen from the three datasets • Series of forgeries are applied to them • Different circle radius ranging from 2 to 6 are used, with 1 increment • Optimum at r = 4, as shown in the diagram below
Experimental results - Setting Thresholds (3) • Choosing the threshold parameters, b, Dsimilar, Nd, and Nnumber, is also challenging • Colour images: • The optimal values: 8, 0.0015, 120 and 5 for b, Dsimilar, Nd, and Nnumber,, respectively • Gray images: • The optimal values: 8, 0.0025, 25 and 5 for b, Dsimilar, Nd, and Nnumber, respectively
Experimental results – Effective testing • To test the proposed method, gray images of different sizes are chosen: • Tempered regions of sizes: 32x32, 64x64, 96x96, 128x128, are tested The detection results (from left to right is the original image, tampered image, detection results)
Experimental results – Robustness and accuracy test • Signal-to-noise ratio (SNR): level of a desired signal to the level of background noise (a)–(b) DAR/FPR performance with SNR, and (c)–(d) DAR/FPR performance with Gaussian blurring
Experimental results – Robustness and accuracy test (2) DAR/FPR curves for DCT, DCT-improved, PCA, FMT, and Proposed methods when the duplicated region is 64 pixels 64 pixels. (a)–(b) with different SNR levels, and (c)–(d) with Gaussian blurring
Experimental results – Demonstration The detection results for non-regular copy-move forgery
Experimental results – Demonstration (2) The test results for multiple copy-move forgery under a mixed operation
Experimental results – Demonstration (3) The top row are tampered images with duplicated region size of 32 pixels × 32 pixels. Shown below are the detection results using our algorithm
Experimental results – Demonstration (4) a) the original image b) the manipulated image • c) The analyzed image (Python script) • Duplicated regions were detected
Experimental results – Demonstration (5) a) Original image b) Manipulated image • c) The analyzed image (Python script) • Used --blcoldev=0.05 • False positive • Duplicate regions were not detected
Experimental results – Demonstration (6) a) the original image b) the manipulated image • c) The analyzed image (Python script) • Partial part of the duplicated region was detected
Flowchart of the proposed scheme Summary • The chart illustrates a summary of how the proposed algorithm works
Summary(2) • Automatic and efficient detection algorithm for copy-move forgery have been presented • Contributions • Outperforms contemporary algorithms in speed and storage • Robust to various attacks: multiple copy-move forgery, Gaussian blurring, and noise contamination • Different way of representing blocks (circles), reducing memory requirements
References • A robust detection algorithm for copy-move forgery in digital images; By: Yanjun Cao a,*, TiegangGao b, Li Fan a, Qunting Yang • Wikipedia: The Free Encyclopedia. Wikimedia Foundation, Inc. 22 July 2004. Web. 10 Aug. 2004 • cao2012-image-forgery-slides.ppt; By: Li-Ting Liao • The Discrete Cosine Transform (DCT): Theory and Application1; By: Syed Ali Khayam • A tutorial on Principal Components Analysis; By: Lindsay I Smith