Download
1 / 23
230 likes | 313 Views
Two-Way Tables Normal Distributions. Categorical Variables. Review: Categorical Variables place individuals into one of several groups or categories. The values of a categorical variable are labels for the different categories.

E N D
Categorical Variables • Review: Categorical Variables place individuals into one of several groups or categories. • The values of a categorical variable are labels for the different categories. • The distribution of a categorical variable lists the count or percent of individuals who fall into each category. When a dataset involves two categorical variables, we begin by examining the counts or percents in various categories for one of the variables. Two-way Table – describes two categorical variables, organizing counts according to a row variable and a column variable.
Two-Way Table What are the variables described by this two-way table? How many young adults were surveyed?
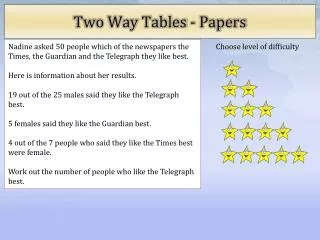
Practice 1: Complete the following tables • Students are asked if they prefer to go swimming or to the gym. 2) Some people are asked about their favorite outdoor sport.
Fill in the gaps 110 130 295 595
Marginal Distribution TheMarginal Distribution of one of the categorical variables in a two-way table of counts is the distribution of values of that variable among all individuals described by the table. Note: Percent's are often more informative than counts, especially when comparing groups of different sizes. To examine a marginal distribution: Use the data in the table to calculate the marginal distribution (in percent's) of the row or column totals. Make a graph to display the marginal distribution.
Variables Example: Age and Education “Age groups” is the categorical explanatory variable “Education level” is the categorical response variable Marginal distributions Chapter 6
Variables 27,85858,07744,46544,828 37,786 81,435 56,008 Marginal totals Example: Marginal Totals Chapter 6
Marginal Distributions Marginal distributions are used as background information only. They do not address association Chapter 6
Marginal Distribution, Row Variable Chapter 6
Marginal Distribution, Column Variable BPS Chapter 6 11
Marginal Distribution Examine the marginal distribution of chance of getting rich.
Practice 2: Copy and complete the following two-way table about ways of eating potato and then answer the questions. • How many boys liked mashed? • How many teachers preferred new potatoes? • How many girls were asked? • Out of the people who liked chips, how many were boys?
Practice 3: For the following two-way table answer the questions on probability. A person is picked at random from the sample. • What is the probability the person picked is a boy? • What is the probability the person liked mash? • What is the probability the person was a teacher who preferred new potatoes? • What is the probability that, out of the girls, the person liked chips? • Out of the people who liked chips, what is the probability the person was a boy?
100g 200g 300g Total 120 Ground 50 Powder 80 26 35 Granules 40 45 Total 135 135 400 TAIL • Coffee is sold in three types and in three weights. • How many people bought 100g of powdered coffee? • How many people bought ground coffee? • Out of the packets weighing 200g, what is the probability the packet bought contained granules? For the following table, copy and complete it, then answer the questionsabout types of coffee bought. Are you ready for the answers ? Next
100g 200g 300g Total Ground 15 50 55 120 Powder 80 35 26 141 Granules 40 45 54 139 Total 135 130 135 400 Answers (a) 80 (b) 120 (c) 45/130
What is the probability that… • A student has an Ipod? • A student has been to Myrtle Beach? • A student does not have an Ipod? • A student has not been to Myrtle Beach? • A student has an Ipodand has been to the Myrtle Beach? • A student has an Ipodor has been to Myrtle Beach) • A student does not have an Ipodor has not been to the Myrtle Beach?
What is the probability that… • A student has brown hair? • A student spent less than 2 hours watching TV last night? • A brunette student spent less than 2 hours watching TV last night? • A student who was watching TV for more than 2 hours last night is brunette?
Questions? • Write your own set of at least 5 questions you could answer using the previous two-way table.